Mode, Median & Arithmetic Mean (Edexcel GCSE Statistics)
Revision Note

Author
RogerExpertise
Maths
Mode, Median & Mean from Discrete Data
Why do we have different types of average?
You’ll hear the phrase “on average” used a lot
For example
by politicians talking about the economy
by sports analysts
However not all data is numerical
e.g. the party people voted for in the last election
And even when data is numerical
some of the data may lead to misleading results
This is why we have 3 types of average
What are the three types of average?
1. Mean
This is what people usually mean when they say “average”
In an ideal world where everybody had the same amount of some resource
the mean is the amount of that resource that each person would have
It is also known as the arithmetic mean
It is the total of all the values divided by the number of values
format('truetype')%3Bfont-weight%3Anormal%3Bfont-style%3Anormal%3B%7D%3C%2Fstyle%3E%3C%2Fdefs%3E%3Ctext%20font-family%3D%22Times%20New%20Roman%22%20font-size%3D%2218%22%20text-anchor%3D%22middle%22%20x%3D%2219.5%22%20y%3D%2230%22%3Emean%3C%2Ftext%3E%3Ctext%20font-family%3D%22math17f39f8317fbdb1988ef4c628eb%22%20font-size%3D%2216%22%20text-anchor%3D%22middle%22%20x%3D%2251.5%22%20y%3D%2230%22%3E%3D%3C%2Ftext%3E%3Cline%20stroke%3D%22%23000000%22%20stroke-linecap%3D%22square%22%20stroke-width%3D%221%22%20x1%3D%2266.5%22%20x2%3D%22193.5%22%20y1%3D%2223.5%22%20y2%3D%2223.5%22%2F%3E%3Ctext%20font-family%3D%22Times%20New%20Roman%22%20font-size%3D%2218%22%20text-anchor%3D%22middle%22%20x%3D%2296.5%22%20y%3D%2216%22%3Esum%3C%2Ftext%3E%3Ctext%20font-family%3D%22Times%20New%20Roman%22%20font-size%3D%2218%22%20text-anchor%3D%22middle%22%20x%3D%22122.5%22%20y%3D%2216%22%3Eof%3C%2Ftext%3E%3Ctext%20font-family%3D%22Times%20New%20Roman%22%20font-size%3D%2218%22%20text-anchor%3D%22middle%22%20x%3D%22157.5%22%20y%3D%2216%22%3Evalues%3C%2Ftext%3E%3Ctext%20font-family%3D%22Times%20New%20Roman%22%20font-size%3D%2218%22%20text-anchor%3D%22middle%22%20x%3D%2295.5%22%20y%3D%2241%22%3Enumber%3C%2Ftext%3E%3Ctext%20font-family%3D%22Times%20New%20Roman%22%20font-size%3D%2218%22%20text-anchor%3D%22middle%22%20x%3D%22134.5%22%20y%3D%2241%22%3Eof%3C%2Ftext%3E%3Ctext%20font-family%3D%22Times%20New%20Roman%22%20font-size%3D%2218%22%20text-anchor%3D%22middle%22%20x%3D%22169.5%22%20y%3D%2241%22%3Evalues%3C%2Ftext%3E%3C%2Fsvg%3E)
i.e. add up all the data values
then divide by how many values there are
Problems with the mean occur when there are one or two unusually high (or low) values in the data (outliers)
These can make the mean too high (or too low) to accurately represent any patterns in the data
2. Median
This is similar to the word medium, which can mean 'in the middle'
So the median is the middle value
But beware, the data has to be arranged into numerical order first!
Use the median instead of the mean if you don't want extreme values (outliers) affecting the average
If there are an odd number of values, there will only be one middle value
This will be the
format('truetype')%3Bfont-weight%3Anormal%3Bfont-style%3Anormal%3B%7D%3C%2Fstyle%3E%3C%2Fdefs%3E%3Cline%20stroke%3D%22%23000000%22%20stroke-linecap%3D%22square%22%20stroke-width%3D%221%22%20x1%3D%222.5%22%20x2%3D%2241.5%22%20y1%3D%2223.5%22%20y2%3D%2223.5%22%2F%3E%3Ctext%20font-family%3D%22Times%20New%20Roman%22%20font-size%3D%2218%22%20font-style%3D%22italic%22%20text-anchor%3D%22middle%22%20x%3D%228.5%22%20y%3D%2216%22%3En%3C%2Ftext%3E%3Ctext%20font-family%3D%22math117e62166fc8586dfa4d1bc0e17%22%20font-size%3D%2216%22%20text-anchor%3D%22middle%22%20x%3D%2222.5%22%20y%3D%2216%22%3E%2B%3C%2Ftext%3E%3Ctext%20font-family%3D%22Times%20New%20Roman%22%20font-size%3D%2218%22%20text-anchor%3D%22middle%22%20x%3D%2235.5%22%20y%3D%2216%22%3E1%3C%2Ftext%3E%3Ctext%20font-family%3D%22Times%20New%20Roman%22%20font-size%3D%2218%22%20text-anchor%3D%22middle%22%20x%3D%2222.5%22%20y%3D%2241%22%3E2%3C%2Ftext%3E%3C%2Fsvg%3E) th value
th valuee.g. for 35 data values,
format('truetype')%3Bfont-weight%3Anormal%3Bfont-style%3Anormal%3B%7D%3C%2Fstyle%3E%3C%2Fdefs%3E%3Ctext%20font-family%3D%22Times%20New%20Roman%22%20font-size%3D%2218%22%20font-style%3D%22italic%22%20text-anchor%3D%22middle%22%20x%3D%224.5%22%20y%3D%2216%22%3En%3C%2Ftext%3E%3Ctext%20font-family%3D%22math17f39f8317fbdb1988ef4c628eb%22%20font-size%3D%2216%22%20text-anchor%3D%22middle%22%20x%3D%2218.5%22%20y%3D%2216%22%3E%3D%3C%2Ftext%3E%3Ctext%20font-family%3D%22Times%20New%20Roman%22%20font-size%3D%2218%22%20text-anchor%3D%22middle%22%20x%3D%2236.5%22%20y%3D%2216%22%3E35%3C%2Ftext%3E%3C%2Fsvg%3E) and
and format('truetype')%3Bfont-weight%3Anormal%3Bfont-style%3Anormal%3B%7D%3C%2Fstyle%3E%3C%2Fdefs%3E%3Cline%20stroke%3D%22%23000000%22%20stroke-linecap%3D%22square%22%20stroke-width%3D%221%22%20x1%3D%222.5%22%20x2%3D%2241.5%22%20y1%3D%2223.5%22%20y2%3D%2223.5%22%2F%3E%3Ctext%20font-family%3D%22Times%20New%20Roman%22%20font-size%3D%2218%22%20font-style%3D%22italic%22%20text-anchor%3D%22middle%22%20x%3D%228.5%22%20y%3D%2216%22%3En%3C%2Ftext%3E%3Ctext%20font-family%3D%22math12ed72e0d2d50af08c235c494fe%22%20font-size%3D%2216%22%20text-anchor%3D%22middle%22%20x%3D%2222.5%22%20y%3D%2216%22%3E%2B%3C%2Ftext%3E%3Ctext%20font-family%3D%22Times%20New%20Roman%22%20font-size%3D%2218%22%20text-anchor%3D%22middle%22%20x%3D%2235.5%22%20y%3D%2216%22%3E1%3C%2Ftext%3E%3Ctext%20font-family%3D%22Times%20New%20Roman%22%20font-size%3D%2218%22%20text-anchor%3D%22middle%22%20x%3D%2222.5%22%20y%3D%2241%22%3E2%3C%2Ftext%3E%3Ctext%20font-family%3D%22math12ed72e0d2d50af08c235c494fe%22%20font-size%3D%2216%22%20text-anchor%3D%22middle%22%20x%3D%2252.5%22%20y%3D%2230%22%3E%3D%3C%2Ftext%3E%3Cline%20stroke%3D%22%23000000%22%20stroke-linecap%3D%22square%22%20stroke-width%3D%221%22%20x1%3D%2263.5%22%20x2%3D%22110.5%22%20y1%3D%2223.5%22%20y2%3D%2223.5%22%2F%3E%3Ctext%20font-family%3D%22Times%20New%20Roman%22%20font-size%3D%2218%22%20text-anchor%3D%22middle%22%20x%3D%2274.5%22%20y%3D%2216%22%3E35%3C%2Ftext%3E%3Ctext%20font-family%3D%22math12ed72e0d2d50af08c235c494fe%22%20font-size%3D%2216%22%20text-anchor%3D%22middle%22%20x%3D%2291.5%22%20y%3D%2216%22%3E%2B%3C%2Ftext%3E%3Ctext%20font-family%3D%22Times%20New%20Roman%22%20font-size%3D%2218%22%20text-anchor%3D%22middle%22%20x%3D%22104.5%22%20y%3D%2216%22%3E1%3C%2Ftext%3E%3Ctext%20font-family%3D%22Times%20New%20Roman%22%20font-size%3D%2218%22%20text-anchor%3D%22middle%22%20x%3D%2287.5%22%20y%3D%2241%22%3E2%3C%2Ftext%3E%3Ctext%20font-family%3D%22math12ed72e0d2d50af08c235c494fe%22%20font-size%3D%2216%22%20text-anchor%3D%22middle%22%20x%3D%22121.5%22%20y%3D%2230%22%3E%3D%3C%2Ftext%3E%3Ctext%20font-family%3D%22Times%20New%20Roman%22%20font-size%3D%2218%22%20text-anchor%3D%22middle%22%20x%3D%22139.5%22%20y%3D%2230%22%3E18%3C%2Ftext%3E%3C%2Fsvg%3E)
So the median will be the 18th value
If there are an even number of values there will be two values in the middle
In this case we take the halfway point between these two values
Often the halfway point is obvious
If not, add the two middle values and divide by 2
this is the same as finding the mean of the two middle values
3. Mode
Think of MOde as meaning the Most Often
i.e. it is the value that occurs the greatest number of times
It is often used for things like “favourite …” or “… sold the most” or “… were the most popular”
Not all data is numerical and that is where the mode is especially useful
But be aware that the mode can be applied to numerical data
e.g. data about sales of clothing or shoes in different sizes
mode would be the best average for determining demand for the sizes
The mode is sometimes referred to using the word modal
e.g. you may see a phrase like “modal value”
This means the same thing, the value occurring most often
Sometimes no value occurs more often than any other
In this case we say there is no mode
If two values occur most often we may say there are two modes
or say that the data set is bi-modal
Whether it is appropriate to do this will depend on what the data is about
How do changes in the data affect the average?
You should be able to determine how a change in the data can affect the mean, median or mode
For example adding or removing data values to the set
You can always recalculate the averages using the changed data set
This may be necessary if you need the exact values of the new averages
But sometimes you can use logic to decide what kind of change will occur
For the mode
If an added data value is equal to the modal value, it will not change the mode
If a removed data value is not equal to the modal value, it will not change the mode
Otherwise recalculate
For the mean
If an added data value is
greater than the mean, the mean will increase
less than the mean, the mean will decrease
If a removed data value is
greater than the mean, the mean will decrease
less than the mean, the mean will increase
(If an added or removed data value is equal to the mean, the mean will not change!)
Recalculate to find the exact value of a changed mean
For the median
You will need to examine the changed data set to decide if the median has changed
Make sure the values in the changed set are written in order!
Worked Example
(a) Briefly explain why the mean is not a suitable average to use in order to analyse people's favourite flavour of ice cream.
Ice cream flavours have names, so the data is qualitative (non-numerical)
(b) Suggest a better measure of average that can be used.
The mode can be used for non-numerical data
Worked Example
15 students were timed to see how long it took them to solve a maths problem. Their times, in seconds, are given below.
12 | 10 | 15 | 14 | 17 |
11 | 12 | 13 | 9 | 21 |
14 | 20 | 19 | 16 | 23 |
(a) Find the mean and median times.
There are quite a few numbers to add up, so it helps to add the rows
12 + 10 + 15 + 14 + 17 = 68
11 + 12 + 13 + 9 + 21 = 66
14 + 20 + 19 + 16 + 23 = 92format('truetype')%3Bfont-weight%3Anormal%3Bfont-style%3Anormal%3B%7D%3C%2Fstyle%3E%3C%2Fdefs%3E%3Ctext%20fill%3D%22%23ED4850%22%20font-family%3D%22Times%20New%20Roman%22%20font-size%3D%2218%22%20text-anchor%3D%22middle%22%20x%3D%2220.5%22%20y%3D%2230%22%3EMean%3C%2Ftext%3E%3Ctext%20fill%3D%22%23ED4850%22%20font-family%3D%22math1b5dc6aeb84bcea29a76d1e9d00%22%20font-size%3D%2216%22%20text-anchor%3D%22middle%22%20x%3D%2249.5%22%20y%3D%2230%22%3E%3D%3C%2Ftext%3E%3Cline%20stroke%3D%22%23ED4850%22%20stroke-linecap%3D%22square%22%20stroke-width%3D%221%22%20x1%3D%2260.5%22%20x2%3D%22151.5%22%20y1%3D%2223.5%22%20y2%3D%2223.5%22%2F%3E%3Ctext%20fill%3D%22%23ED4850%22%20font-family%3D%22Times%20New%20Roman%22%20font-size%3D%2218%22%20text-anchor%3D%22middle%22%20x%3D%2271.5%22%20y%3D%2216%22%3E68%3C%2Ftext%3E%3Ctext%20fill%3D%22%23ED4850%22%20font-family%3D%22math1b5dc6aeb84bcea29a76d1e9d00%22%20font-size%3D%2216%22%20text-anchor%3D%22middle%22%20x%3D%2288.5%22%20y%3D%2216%22%3E%2B%3C%2Ftext%3E%3Ctext%20fill%3D%22%23ED4850%22%20font-family%3D%22Times%20New%20Roman%22%20font-size%3D%2218%22%20text-anchor%3D%22middle%22%20x%3D%22106.5%22%20y%3D%2216%22%3E66%3C%2Ftext%3E%3Ctext%20fill%3D%22%23ED4850%22%20font-family%3D%22math1b5dc6aeb84bcea29a76d1e9d00%22%20font-size%3D%2216%22%20text-anchor%3D%22middle%22%20x%3D%22123.5%22%20y%3D%2216%22%3E%2B%3C%2Ftext%3E%3Ctext%20fill%3D%22%23ED4850%22%20font-family%3D%22Times%20New%20Roman%22%20font-size%3D%2218%22%20text-anchor%3D%22middle%22%20x%3D%22141.5%22%20y%3D%2216%22%3E92%3C%2Ftext%3E%3Ctext%20fill%3D%22%23ED4850%22%20font-family%3D%22Times%20New%20Roman%22%20font-size%3D%2218%22%20text-anchor%3D%22middle%22%20x%3D%22106.5%22%20y%3D%2241%22%3E15%3C%2Ftext%3E%3Ctext%20fill%3D%22%23ED4850%22%20font-family%3D%22math1b5dc6aeb84bcea29a76d1e9d00%22%20font-size%3D%2216%22%20text-anchor%3D%22middle%22%20x%3D%2249.5%22%20y%3D%2281%22%3E%3D%3C%2Ftext%3E%3Cline%20stroke%3D%22%23ED4850%22%20stroke-linecap%3D%22square%22%20stroke-width%3D%221%22%20x1%3D%2260.5%22%20x2%3D%2290.5%22%20y1%3D%2274.5%22%20y2%3D%2274.5%22%2F%3E%3Ctext%20fill%3D%22%23ED4850%22%20font-family%3D%22Times%20New%20Roman%22%20font-size%3D%2218%22%20text-anchor%3D%22middle%22%20x%3D%2275.5%22%20y%3D%2267%22%3E226%3C%2Ftext%3E%3Ctext%20fill%3D%22%23ED4850%22%20font-family%3D%22Times%20New%20Roman%22%20font-size%3D%2218%22%20text-anchor%3D%22middle%22%20x%3D%2276.5%22%20y%3D%2292%22%3E15%3C%2Ftext%3E%3Ctext%20fill%3D%22%23ED4850%22%20font-family%3D%22math1b5dc6aeb84bcea29a76d1e9d00%22%20font-size%3D%2216%22%20text-anchor%3D%22middle%22%20x%3D%2249.5%22%20y%3D%22118%22%3E%3D%3C%2Ftext%3E%3Ctext%20fill%3D%22%23ED4850%22%20font-family%3D%22Times%20New%20Roman%22%20font-size%3D%2218%22%20text-anchor%3D%22middle%22%20x%3D%2267.5%22%20y%3D%22118%22%3E15%3C%2Ftext%3E%3Ctext%20fill%3D%22%23ED4850%22%20font-family%3D%22math1b5dc6aeb84bcea29a76d1e9d00%22%20font-size%3D%2216%22%20text-anchor%3D%22middle%22%20x%3D%2278.5%22%20y%3D%22118%22%3E.%3C%2Ftext%3E%3Ctext%20fill%3D%22%23ED4850%22%20font-family%3D%22Times%20New%20Roman%22%20font-size%3D%2218%22%20text-anchor%3D%22middle%22%20x%3D%2294.5%22%20y%3D%22118%22%3E066%3C%2Ftext%3E%3Ctext%20fill%3D%22%23ED4850%22%20font-family%3D%22Times%20New%20Roman%22%20font-size%3D%2218%22%20text-anchor%3D%22middle%22%20x%3D%22125.5%22%20y%3D%22118%22%3E666%3C%2Ftext%3E%3Ctext%20fill%3D%22%23ED4850%22%20font-family%3D%22math1b5dc6aeb84bcea29a76d1e9d00%22%20font-size%3D%2216%22%20text-anchor%3D%22middle%22%20x%3D%22145.5%22%20y%3D%22118%22%3E.%3C%2Ftext%3E%3Ctext%20fill%3D%22%23ED4850%22%20font-family%3D%22math1b5dc6aeb84bcea29a76d1e9d00%22%20font-size%3D%2216%22%20text-anchor%3D%22middle%22%20x%3D%22150.5%22%20y%3D%22118%22%3E.%3C%2Ftext%3E%3Ctext%20fill%3D%22%23ED4850%22%20font-family%3D%22math1b5dc6aeb84bcea29a76d1e9d00%22%20font-size%3D%2216%22%20text-anchor%3D%22middle%22%20x%3D%22155.5%22%20y%3D%22118%22%3E.%3C%2Ftext%3E%3C%2Fsvg%3E)
For the median, the data needs to be in order first
%22%2F%3E%3Ctext%20fill%3D%22%23ED4850%22%20font-family%3D%22Times%20New%20Roman%22%20font-size%3D%2218%22%20text-anchor%3D%22middle%22%20x%3D%22242.5%22%20y%3D%2221%22%3E14%3C%2Ftext%3E%3Cline%20stroke%3D%22%23ED4850%22%20stroke-linecap%3D%22square%22%20stroke-width%3D%221%22%20x1%3D%22271.5%22%20x2%3D%22288.5%22%20y1%3D%2225.5%22%20y2%3D%225.5%22%2F%3E%3Ctext%20fill%3D%22%23ED4850%22%20font-family%3D%22Times%20New%20Roman%22%20font-size%3D%2218%22%20text-anchor%3D%22middle%22%20x%3D%22280.5%22%20y%3D%2221%22%3E15%3C%2Ftext%3E%3Cline%20stroke%3D%22%23ED4850%22%20stroke-linecap%3D%22square%22%20stroke-width%3D%221%22%20x1%3D%22305.5%22%20x2%3D%22322.5%22%20y1%3D%2225.5%22%20y2%3D%225.5%22%2F%3E%3Ctext%20fill%3D%22%23ED4850%22%20font-family%3D%22Times%20New%20Roman%22%20font-size%3D%2218%22%20text-anchor%3D%22middle%22%20x%3D%22314.5%22%20y%3D%2221%22%3E16%3C%2Ftext%3E%3Cline%20stroke%3D%22%23ED4850%22%20stroke-linecap%3D%22square%22%20stroke-width%3D%221%22%20x1%3D%22339.5%22%20x2%3D%22356.5%22%20y1%3D%2225.5%22%20y2%3D%225.5%22%2F%3E%3Ctext%20fill%3D%22%23ED4850%22%20font-family%3D%22Times%20New%20Roman%22%20font-size%3D%2218%22%20text-anchor%3D%22middle%22%20x%3D%22348.5%22%20y%3D%2221%22%3E17%3C%2Ftext%3E%3Cline%20stroke%3D%22%23ED4850%22%20stroke-linecap%3D%22square%22%20stroke-width%3D%221%22%20x1%3D%22373.5%22%20x2%3D%22390.5%22%20y1%3D%2225.5%22%20y2%3D%225.5%22%2F%3E%3Ctext%20fill%3D%22%23ED4850%22%20font-family%3D%22Times%20New%20Roman%22%20font-size%3D%2218%22%20text-anchor%3D%22middle%22%20x%3D%22382.5%22%20y%3D%2221%22%3E19%3C%2Ftext%3E%3Cline%20stroke%3D%22%23ED4850%22%20stroke-linecap%3D%22square%22%20stroke-width%3D%221%22%20x1%3D%22407.5%22%20x2%3D%22424.5%22%20y1%3D%2225.5%22%20y2%3D%225.5%22%2F%3E%3Ctext%20fill%3D%22%23ED4850%22%20font-family%3D%22Times%20New%20Roman%22%20font-size%3D%2218%22%20text-anchor%3D%22middle%22%20x%3D%22416.5%22%20y%3D%2221%22%3E20%3C%2Ftext%3E%3Cline%20stroke%3D%22%23ED4850%22%20stroke-linecap%3D%22square%22%20stroke-width%3D%221%22%20x1%3D%22441.5%22%20x2%3D%22458.5%22%20y1%3D%2225.5%22%20y2%3D%225.5%22%2F%3E%3Ctext%20fill%3D%22%23ED4850%22%20font-family%3D%22Times%20New%20Roman%22%20font-size%3D%2218%22%20text-anchor%3D%22middle%22%20x%3D%22450.5%22%20y%3D%2221%22%3E21%3C%2Ftext%3E%3Cline%20stroke%3D%22%23ED4850%22%20stroke-linecap%3D%22square%22%20stroke-width%3D%221%22%20x1%3D%22475.5%22%20x2%3D%22492.5%22%20y1%3D%2225.5%22%20y2%3D%225.5%22%2F%3E%3Ctext%20fill%3D%22%23ED4850%22%20font-family%3D%22Times%20New%20Roman%22%20font-size%3D%2218%22%20text-anchor%3D%22middle%22%20x%3D%22484.5%22%20y%3D%2221%22%3E23%3C%2Ftext%3E%3C%2Fsvg%3E)
Mean = 15.1 seconds (to 3 s.f.)
Median time = 14 seconds
Problem-solving with the Mean
What does problem-solving with the mean involve?
The mean is calculated from a formula
You could be asked questions that require
using the formula 'backwards'
rearranging the formula
This is a formula involving 3 quantities
If you know any 2, you can find the other one
What types of problems might I need to solve?
Typical questions ask you to either
work backwards from a known mean or
combine means for two data sets
An exam question can always ask something unusual that you haven’t seen before
So you can't just practice 'every type of question' for this topic
You will need to make sure you understand
what the mean is
how it works
and what it shows
How do I solve problems involving the mean?
Known mean, unknown data value
This is working backwards from the mean, to an unknown data value
Call the unknown data value
 , say
, sayUsing the 'formula' for the mean, set up an equation in
Rearrange and solve the equation to find
, the unknown data value
Combined means for two data sets
This is where we know the mean for two different data sets but would like to know the overall mean
We need to find the overall total of values from both data sets
then divide by the total number of values across both data sets
Alternatively we may know the overall mean and want to
work back to the mean of one or both of the data sets
or to an unknown data value
Others
Due to the problem solving nature of such questions there will be variation in question styles
The above two should give you a good idea and cover the vast majority of questions
The best way to start tackling questions with the mean is to
write down the quantities you do know
write down those you don't know
use the 'formula' for the mean to link the unknown and known values
Exam Tip
After using the mean so often in mathematics
it's easy to forget that it's based on a formula
As with other work involving formulas,
write down the information you know
and separately write down the information you are trying to find
Worked Example
A class of 24 students have a mean height of 1.56 metres.
Two new students join the class and the mean height of the class increases to 1.58 metres.
Given that the two new students are of equal height, find their height.
Start by writing down what we do know
Number of students originally in the class: n1 = 24
Mean of the original 24 students: m1 = 1.56
Number after new students: n2 = 24 + 2 = 26
Mean after new students: m2 = 1.58
And now write down what we don't know (but need to know to answer the question)
Height of the two new students (both equal): h metres
Total of all heights before new students: T1
Total of all heights after new students: T2 = T1 + h + h = T1 + 2h
Considering the formula for the mean, and the values before the new students joined, we can work out T1
format('truetype')%3Bfont-weight%3Anormal%3Bfont-style%3Anormal%3B%7D%3C%2Fstyle%3E%3C%2Fdefs%3E%3Ctext%20fill%3D%22%23ED4850%22%20font-family%3D%22Times%20New%20Roman%22%20font-size%3D%2218%22%20font-style%3D%22italic%22%20text-anchor%3D%22middle%22%20x%3D%2217.5%22%20y%3D%2236%22%3Em%3C%2Ftext%3E%3Ctext%20fill%3D%22%23ED4850%22%20font-family%3D%22Times%20New%20Roman%22%20font-size%3D%2213%22%20text-anchor%3D%22middle%22%20x%3D%2228.5%22%20y%3D%2244%22%3E1%3C%2Ftext%3E%3Ctext%20fill%3D%22%23ED4850%22%20font-family%3D%22math17994cda3defe015d857709bac5%22%20font-size%3D%2216%22%20text-anchor%3D%22middle%22%20x%3D%2240.5%22%20y%3D%2236%22%3E%3D%3C%2Ftext%3E%3Cline%20stroke%3D%22%23ED4850%22%20stroke-linecap%3D%22square%22%20stroke-width%3D%221%22%20x1%3D%2251.5%22%20x2%3D%2273.5%22%20y1%3D%2229.5%22%20y2%3D%2229.5%22%2F%3E%3Ctext%20fill%3D%22%23ED4850%22%20font-family%3D%22Times%20New%20Roman%22%20font-size%3D%2218%22%20font-style%3D%22italic%22%20text-anchor%3D%22middle%22%20x%3D%2258.5%22%20y%3D%2216%22%3ET%3C%2Ftext%3E%3Ctext%20fill%3D%22%23ED4850%22%20font-family%3D%22Times%20New%20Roman%22%20font-size%3D%2213%22%20text-anchor%3D%22middle%22%20x%3D%2268.5%22%20y%3D%2224%22%3E1%3C%2Ftext%3E%3Ctext%20fill%3D%22%23ED4850%22%20font-family%3D%22Times%20New%20Roman%22%20font-size%3D%2218%22%20font-style%3D%22italic%22%20text-anchor%3D%22middle%22%20x%3D%2258.5%22%20y%3D%2247%22%3En%3C%2Ftext%3E%3Ctext%20fill%3D%22%23ED4850%22%20font-family%3D%22Times%20New%20Roman%22%20font-size%3D%2213%22%20text-anchor%3D%22middle%22%20x%3D%2267.5%22%20y%3D%2255%22%3E1%3C%2Ftext%3E%3Ctext%20fill%3D%22%23ED4850%22%20font-family%3D%22Times%20New%20Roman%22%20font-size%3D%2218%22%20text-anchor%3D%22middle%22%20x%3D%224.5%22%20y%3D%2299%22%3E1%3C%2Ftext%3E%3Ctext%20fill%3D%22%23ED4850%22%20font-family%3D%22math17994cda3defe015d857709bac5%22%20font-size%3D%2216%22%20text-anchor%3D%22middle%22%20x%3D%2211.5%22%20y%3D%2299%22%3E.%3C%2Ftext%3E%3Ctext%20fill%3D%22%23ED4850%22%20font-family%3D%22Times%20New%20Roman%22%20font-size%3D%2218%22%20text-anchor%3D%22middle%22%20x%3D%2223.5%22%20y%3D%2299%22%3E56%3C%2Ftext%3E%3Ctext%20fill%3D%22%23ED4850%22%20font-family%3D%22math17994cda3defe015d857709bac5%22%20font-size%3D%2216%22%20text-anchor%3D%22middle%22%20x%3D%2240.5%22%20y%3D%2299%22%3E%3D%3C%2Ftext%3E%3Cline%20stroke%3D%22%23ED4850%22%20stroke-linecap%3D%22square%22%20stroke-width%3D%221%22%20x1%3D%2251.5%22%20x2%3D%2273.5%22%20y1%3D%2292.5%22%20y2%3D%2292.5%22%2F%3E%3Ctext%20fill%3D%22%23ED4850%22%20font-family%3D%22Times%20New%20Roman%22%20font-size%3D%2218%22%20font-style%3D%22italic%22%20text-anchor%3D%22middle%22%20x%3D%2258.5%22%20y%3D%2279%22%3ET%3C%2Ftext%3E%3Ctext%20fill%3D%22%23ED4850%22%20font-family%3D%22Times%20New%20Roman%22%20font-size%3D%2213%22%20text-anchor%3D%22middle%22%20x%3D%2268.5%22%20y%3D%2287%22%3E1%3C%2Ftext%3E%3Ctext%20fill%3D%22%23ED4850%22%20font-family%3D%22Times%20New%20Roman%22%20font-size%3D%2218%22%20text-anchor%3D%22middle%22%20x%3D%2263.5%22%20y%3D%22110%22%3E24%3C%2Ftext%3E%3Ctext%20fill%3D%22%23ED4850%22%20font-family%3D%22Times%20New%20Roman%22%20font-size%3D%2218%22%20font-style%3D%22italic%22%20text-anchor%3D%22middle%22%20x%3D%2218.5%22%20y%3D%22136%22%3ET%3C%2Ftext%3E%3Ctext%20fill%3D%22%23ED4850%22%20font-family%3D%22Times%20New%20Roman%22%20font-size%3D%2213%22%20text-anchor%3D%22middle%22%20x%3D%2228.5%22%20y%3D%22144%22%3E1%3C%2Ftext%3E%3Ctext%20fill%3D%22%23ED4850%22%20font-family%3D%22math17994cda3defe015d857709bac5%22%20font-size%3D%2216%22%20text-anchor%3D%22middle%22%20x%3D%2240.5%22%20y%3D%22136%22%3E%3D%3C%2Ftext%3E%3Ctext%20fill%3D%22%23ED4850%22%20font-family%3D%22Times%20New%20Roman%22%20font-size%3D%2218%22%20text-anchor%3D%22middle%22%20x%3D%2253.5%22%20y%3D%22136%22%3E1%3C%2Ftext%3E%3Ctext%20fill%3D%22%23ED4850%22%20font-family%3D%22math17994cda3defe015d857709bac5%22%20font-size%3D%2216%22%20text-anchor%3D%22middle%22%20x%3D%2260.5%22%20y%3D%22136%22%3E.%3C%2Ftext%3E%3Ctext%20fill%3D%22%23ED4850%22%20font-family%3D%22Times%20New%20Roman%22%20font-size%3D%2218%22%20text-anchor%3D%22middle%22%20x%3D%2272.5%22%20y%3D%22136%22%3E56%3C%2Ftext%3E%3Ctext%20fill%3D%22%23ED4850%22%20font-family%3D%22math17994cda3defe015d857709bac5%22%20font-size%3D%2216%22%20text-anchor%3D%22middle%22%20x%3D%2289.5%22%20y%3D%22136%22%3E%26%23xD7%3B%3C%2Ftext%3E%3Ctext%20fill%3D%22%23ED4850%22%20font-family%3D%22Times%20New%20Roman%22%20font-size%3D%2218%22%20text-anchor%3D%22middle%22%20x%3D%22107.5%22%20y%3D%22136%22%3E24%3C%2Ftext%3E%3Ctext%20fill%3D%22%23ED4850%22%20font-family%3D%22Times%20New%20Roman%22%20font-size%3D%2218%22%20font-style%3D%22italic%22%20text-anchor%3D%22middle%22%20x%3D%2218.5%22%20y%3D%22168%22%3ET%3C%2Ftext%3E%3Ctext%20fill%3D%22%23ED4850%22%20font-family%3D%22Times%20New%20Roman%22%20font-size%3D%2213%22%20text-anchor%3D%22middle%22%20x%3D%2228.5%22%20y%3D%22176%22%3E1%3C%2Ftext%3E%3Ctext%20fill%3D%22%23ED4850%22%20font-family%3D%22math17994cda3defe015d857709bac5%22%20font-size%3D%2216%22%20text-anchor%3D%22middle%22%20x%3D%2240.5%22%20y%3D%22168%22%3E%3D%3C%2Ftext%3E%3Ctext%20fill%3D%22%23ED4850%22%20font-family%3D%22Times%20New%20Roman%22%20font-size%3D%2218%22%20text-anchor%3D%22middle%22%20x%3D%2258.5%22%20y%3D%22168%22%3E37%3C%2Ftext%3E%3Ctext%20fill%3D%22%23ED4850%22%20font-family%3D%22math17994cda3defe015d857709bac5%22%20font-size%3D%2216%22%20text-anchor%3D%22middle%22%20x%3D%2269.5%22%20y%3D%22168%22%3E.%3C%2Ftext%3E%3Ctext%20fill%3D%22%23ED4850%22%20font-family%3D%22Times%20New%20Roman%22%20font-size%3D%2218%22%20text-anchor%3D%22middle%22%20x%3D%2281.5%22%20y%3D%22168%22%3E44%3C%2Ftext%3E%3C%2Fsvg%3E)
Using the mean formula for the overall mean, we can set up and solve an equation for h
format('truetype')%3Bfont-weight%3Anormal%3Bfont-style%3Anormal%3B%7D%3C%2Fstyle%3E%3C%2Fdefs%3E%3Ctext%20fill%3D%22%23ED4850%22%20font-family%3D%22Times%20New%20Roman%22%20font-size%3D%2218%22%20font-style%3D%22italic%22%20text-anchor%3D%22middle%22%20x%3D%2262.5%22%20y%3D%2236%22%3Em%3C%2Ftext%3E%3Ctext%20fill%3D%22%23ED4850%22%20font-family%3D%22Times%20New%20Roman%22%20font-size%3D%2213%22%20text-anchor%3D%22middle%22%20x%3D%2273.5%22%20y%3D%2244%22%3E2%3C%2Ftext%3E%3Ctext%20fill%3D%22%23ED4850%22%20font-family%3D%22math131bfb6193d36794f7db8079364%22%20font-size%3D%2216%22%20text-anchor%3D%22middle%22%20x%3D%2285.5%22%20y%3D%2236%22%3E%3D%3C%2Ftext%3E%3Cline%20stroke%3D%22%23ED4850%22%20stroke-linecap%3D%22square%22%20stroke-width%3D%221%22%20x1%3D%2296.5%22%20x2%3D%22118.5%22%20y1%3D%2229.5%22%20y2%3D%2229.5%22%2F%3E%3Ctext%20fill%3D%22%23ED4850%22%20font-family%3D%22Times%20New%20Roman%22%20font-size%3D%2218%22%20font-style%3D%22italic%22%20text-anchor%3D%22middle%22%20x%3D%22103.5%22%20y%3D%2216%22%3ET%3C%2Ftext%3E%3Ctext%20fill%3D%22%23ED4850%22%20font-family%3D%22Times%20New%20Roman%22%20font-size%3D%2213%22%20text-anchor%3D%22middle%22%20x%3D%22113.5%22%20y%3D%2224%22%3E2%3C%2Ftext%3E%3Ctext%20fill%3D%22%23ED4850%22%20font-family%3D%22Times%20New%20Roman%22%20font-size%3D%2218%22%20font-style%3D%22italic%22%20text-anchor%3D%22middle%22%20x%3D%22103.5%22%20y%3D%2247%22%3En%3C%2Ftext%3E%3Ctext%20fill%3D%22%23ED4850%22%20font-family%3D%22Times%20New%20Roman%22%20font-size%3D%2213%22%20text-anchor%3D%22middle%22%20x%3D%22112.5%22%20y%3D%2255%22%3E2%3C%2Ftext%3E%3Ctext%20fill%3D%22%23ED4850%22%20font-family%3D%22Times%20New%20Roman%22%20font-size%3D%2218%22%20text-anchor%3D%22middle%22%20x%3D%2237.5%22%20y%3D%2279%22%3Eand%3C%2Ftext%3E%3Ctext%20fill%3D%22%23ED4850%22%20font-family%3D%22Times%20New%20Roman%22%20font-size%3D%2218%22%20font-style%3D%22italic%22%20text-anchor%3D%22middle%22%20x%3D%2263.5%22%20y%3D%2279%22%3ET%3C%2Ftext%3E%3Ctext%20fill%3D%22%23ED4850%22%20font-family%3D%22Times%20New%20Roman%22%20font-size%3D%2213%22%20text-anchor%3D%22middle%22%20x%3D%2273.5%22%20y%3D%2287%22%3E2%3C%2Ftext%3E%3Ctext%20fill%3D%22%23ED4850%22%20font-family%3D%22math131bfb6193d36794f7db8079364%22%20font-size%3D%2216%22%20text-anchor%3D%22middle%22%20x%3D%2285.5%22%20y%3D%2279%22%3E%3D%3C%2Ftext%3E%3Ctext%20fill%3D%22%23ED4850%22%20font-family%3D%22Times%20New%20Roman%22%20font-size%3D%2218%22%20font-style%3D%22italic%22%20text-anchor%3D%22middle%22%20x%3D%2299.5%22%20y%3D%2279%22%3ET%3C%2Ftext%3E%3Ctext%20fill%3D%22%23ED4850%22%20font-family%3D%22Times%20New%20Roman%22%20font-size%3D%2213%22%20text-anchor%3D%22middle%22%20x%3D%22109.5%22%20y%3D%2287%22%3E1%3C%2Ftext%3E%3Ctext%20fill%3D%22%23ED4850%22%20font-family%3D%22math131bfb6193d36794f7db8079364%22%20font-size%3D%2216%22%20text-anchor%3D%22middle%22%20x%3D%22121.5%22%20y%3D%2279%22%3E%2B%3C%2Ftext%3E%3Ctext%20fill%3D%22%23ED4850%22%20font-family%3D%22Times%20New%20Roman%22%20font-size%3D%2218%22%20text-anchor%3D%22middle%22%20x%3D%22134.5%22%20y%3D%2279%22%3E2%3C%2Ftext%3E%3Ctext%20fill%3D%22%23ED4850%22%20font-family%3D%22Times%20New%20Roman%22%20font-size%3D%2218%22%20font-style%3D%22italic%22%20text-anchor%3D%22middle%22%20x%3D%22143.5%22%20y%3D%2279%22%3Eh%3C%2Ftext%3E%3Ctext%20fill%3D%22%23ED4850%22%20font-family%3D%22math131bfb6193d36794f7db8079364%22%20font-size%3D%2216%22%20text-anchor%3D%22middle%22%20x%3D%22157.5%22%20y%3D%2279%22%3E%3D%3C%2Ftext%3E%3Ctext%20fill%3D%22%23ED4850%22%20font-family%3D%22Times%20New%20Roman%22%20font-size%3D%2218%22%20text-anchor%3D%22middle%22%20x%3D%22175.5%22%20y%3D%2279%22%3E37%3C%2Ftext%3E%3Ctext%20fill%3D%22%23ED4850%22%20font-family%3D%22math131bfb6193d36794f7db8079364%22%20font-size%3D%2216%22%20text-anchor%3D%22middle%22%20x%3D%22186.5%22%20y%3D%2279%22%3E.%3C%2Ftext%3E%3Ctext%20fill%3D%22%23ED4850%22%20font-family%3D%22Times%20New%20Roman%22%20font-size%3D%2218%22%20text-anchor%3D%22middle%22%20x%3D%22198.5%22%20y%3D%2279%22%3E44%3C%2Ftext%3E%3Ctext%20fill%3D%22%23ED4850%22%20font-family%3D%22math131bfb6193d36794f7db8079364%22%20font-size%3D%2216%22%20text-anchor%3D%22middle%22%20x%3D%22215.5%22%20y%3D%2279%22%3E%2B%3C%2Ftext%3E%3Ctext%20fill%3D%22%23ED4850%22%20font-family%3D%22Times%20New%20Roman%22%20font-size%3D%2218%22%20text-anchor%3D%22middle%22%20x%3D%22228.5%22%20y%3D%2279%22%3E2%3C%2Ftext%3E%3Ctext%20fill%3D%22%23ED4850%22%20font-family%3D%22Times%20New%20Roman%22%20font-size%3D%2218%22%20font-style%3D%22italic%22%20text-anchor%3D%22middle%22%20x%3D%22237.5%22%20y%3D%2279%22%3Eh%3C%2Ftext%3E%3Ctext%20fill%3D%22%23ED4850%22%20font-family%3D%22Times%20New%20Roman%22%20font-size%3D%2218%22%20text-anchor%3D%22middle%22%20x%3D%2229.5%22%20y%3D%22125%22%3Eso%3C%2Ftext%3E%3Ctext%20fill%3D%22%23ED4850%22%20font-family%3D%22Times%20New%20Roman%22%20font-size%3D%2218%22%20text-anchor%3D%22middle%22%20x%3D%2249.5%22%20y%3D%22125%22%3E1%3C%2Ftext%3E%3Ctext%20fill%3D%22%23ED4850%22%20font-family%3D%22math131bfb6193d36794f7db8079364%22%20font-size%3D%2216%22%20text-anchor%3D%22middle%22%20x%3D%2256.5%22%20y%3D%22125%22%3E.%3C%2Ftext%3E%3Ctext%20fill%3D%22%23ED4850%22%20font-family%3D%22Times%20New%20Roman%22%20font-size%3D%2218%22%20text-anchor%3D%22middle%22%20x%3D%2268.5%22%20y%3D%22125%22%3E58%3C%2Ftext%3E%3Ctext%20fill%3D%22%23ED4850%22%20font-family%3D%22math131bfb6193d36794f7db8079364%22%20font-size%3D%2216%22%20text-anchor%3D%22middle%22%20x%3D%2285.5%22%20y%3D%22125%22%3E%3D%3C%2Ftext%3E%3Cline%20stroke%3D%22%23ED4850%22%20stroke-linecap%3D%22square%22%20stroke-width%3D%221%22%20x1%3D%2296.5%22%20x2%3D%22176.5%22%20y1%3D%22118.5%22%20y2%3D%22118.5%22%2F%3E%3Ctext%20fill%3D%22%23ED4850%22%20font-family%3D%22Times%20New%20Roman%22%20font-size%3D%2218%22%20text-anchor%3D%22middle%22%20x%3D%22107.5%22%20y%3D%22111%22%3E37%3C%2Ftext%3E%3Ctext%20fill%3D%22%23ED4850%22%20font-family%3D%22math131bfb6193d36794f7db8079364%22%20font-size%3D%2216%22%20text-anchor%3D%22middle%22%20x%3D%22118.5%22%20y%3D%22111%22%3E.%3C%2Ftext%3E%3Ctext%20fill%3D%22%23ED4850%22%20font-family%3D%22Times%20New%20Roman%22%20font-size%3D%2218%22%20text-anchor%3D%22middle%22%20x%3D%22130.5%22%20y%3D%22111%22%3E44%3C%2Ftext%3E%3Ctext%20fill%3D%22%23ED4850%22%20font-family%3D%22math131bfb6193d36794f7db8079364%22%20font-size%3D%2216%22%20text-anchor%3D%22middle%22%20x%3D%22147.5%22%20y%3D%22111%22%3E%2B%3C%2Ftext%3E%3Ctext%20fill%3D%22%23ED4850%22%20font-family%3D%22Times%20New%20Roman%22%20font-size%3D%2218%22%20text-anchor%3D%22middle%22%20x%3D%22160.5%22%20y%3D%22111%22%3E2%3C%2Ftext%3E%3Ctext%20fill%3D%22%23ED4850%22%20font-family%3D%22Times%20New%20Roman%22%20font-size%3D%2218%22%20font-style%3D%22italic%22%20text-anchor%3D%22middle%22%20x%3D%22169.5%22%20y%3D%22111%22%3Eh%3C%2Ftext%3E%3Ctext%20fill%3D%22%23ED4850%22%20font-family%3D%22Times%20New%20Roman%22%20font-size%3D%2218%22%20text-anchor%3D%22middle%22%20x%3D%22137.5%22%20y%3D%22136%22%3E26%3C%2Ftext%3E%3Ctext%20fill%3D%22%23ED4850%22%20font-family%3D%22Times%20New%20Roman%22%20font-size%3D%2218%22%20text-anchor%3D%22middle%22%20x%3D%229.5%22%20y%3D%22162%22%3E37%3C%2Ftext%3E%3Ctext%20fill%3D%22%23ED4850%22%20font-family%3D%22math131bfb6193d36794f7db8079364%22%20font-size%3D%2216%22%20text-anchor%3D%22middle%22%20x%3D%2220.5%22%20y%3D%22162%22%3E.%3C%2Ftext%3E%3Ctext%20fill%3D%22%23ED4850%22%20font-family%3D%22Times%20New%20Roman%22%20font-size%3D%2218%22%20text-anchor%3D%22middle%22%20x%3D%2232.5%22%20y%3D%22162%22%3E44%3C%2Ftext%3E%3Ctext%20fill%3D%22%23ED4850%22%20font-family%3D%22math131bfb6193d36794f7db8079364%22%20font-size%3D%2216%22%20text-anchor%3D%22middle%22%20x%3D%2249.5%22%20y%3D%22162%22%3E%2B%3C%2Ftext%3E%3Ctext%20fill%3D%22%23ED4850%22%20font-family%3D%22Times%20New%20Roman%22%20font-size%3D%2218%22%20text-anchor%3D%22middle%22%20x%3D%2262.5%22%20y%3D%22162%22%3E2%3C%2Ftext%3E%3Ctext%20fill%3D%22%23ED4850%22%20font-family%3D%22Times%20New%20Roman%22%20font-size%3D%2218%22%20font-style%3D%22italic%22%20text-anchor%3D%22middle%22%20x%3D%2271.5%22%20y%3D%22162%22%3Eh%3C%2Ftext%3E%3Ctext%20fill%3D%22%23ED4850%22%20font-family%3D%22math131bfb6193d36794f7db8079364%22%20font-size%3D%2216%22%20text-anchor%3D%22middle%22%20x%3D%2285.5%22%20y%3D%22162%22%3E%3D%3C%2Ftext%3E%3Ctext%20fill%3D%22%23ED4850%22%20font-family%3D%22Times%20New%20Roman%22%20font-size%3D%2218%22%20text-anchor%3D%22middle%22%20x%3D%2298.5%22%20y%3D%22162%22%3E1%3C%2Ftext%3E%3Ctext%20fill%3D%22%23ED4850%22%20font-family%3D%22math131bfb6193d36794f7db8079364%22%20font-size%3D%2216%22%20text-anchor%3D%22middle%22%20x%3D%22105.5%22%20y%3D%22162%22%3E.%3C%2Ftext%3E%3Ctext%20fill%3D%22%23ED4850%22%20font-family%3D%22Times%20New%20Roman%22%20font-size%3D%2218%22%20text-anchor%3D%22middle%22%20x%3D%22117.5%22%20y%3D%22162%22%3E58%3C%2Ftext%3E%3Ctext%20fill%3D%22%23ED4850%22%20font-family%3D%22math131bfb6193d36794f7db8079364%22%20font-size%3D%2216%22%20text-anchor%3D%22middle%22%20x%3D%22134.5%22%20y%3D%22162%22%3E%26%23xD7%3B%3C%2Ftext%3E%3Ctext%20fill%3D%22%23ED4850%22%20font-family%3D%22Times%20New%20Roman%22%20font-size%3D%2218%22%20text-anchor%3D%22middle%22%20x%3D%22152.5%22%20y%3D%22162%22%3E26%3C%2Ftext%3E%3Ctext%20fill%3D%22%23ED4850%22%20font-family%3D%22Times%20New%20Roman%22%20font-size%3D%2218%22%20text-anchor%3D%22middle%22%20x%3D%2262.5%22%20y%3D%22188%22%3E2%3C%2Ftext%3E%3Ctext%20fill%3D%22%23ED4850%22%20font-family%3D%22Times%20New%20Roman%22%20font-size%3D%2218%22%20font-style%3D%22italic%22%20text-anchor%3D%22middle%22%20x%3D%2271.5%22%20y%3D%22188%22%3Eh%3C%2Ftext%3E%3Ctext%20fill%3D%22%23ED4850%22%20font-family%3D%22math131bfb6193d36794f7db8079364%22%20font-size%3D%2216%22%20text-anchor%3D%22middle%22%20x%3D%2285.5%22%20y%3D%22188%22%3E%3D%3C%2Ftext%3E%3Ctext%20fill%3D%22%23ED4850%22%20font-family%3D%22Times%20New%20Roman%22%20font-size%3D%2218%22%20text-anchor%3D%22middle%22%20x%3D%22103.5%22%20y%3D%22188%22%3E41%3C%2Ftext%3E%3Ctext%20fill%3D%22%23ED4850%22%20font-family%3D%22math131bfb6193d36794f7db8079364%22%20font-size%3D%2216%22%20text-anchor%3D%22middle%22%20x%3D%22114.5%22%20y%3D%22188%22%3E.%3C%2Ftext%3E%3Ctext%20fill%3D%22%23ED4850%22%20font-family%3D%22Times%20New%20Roman%22%20font-size%3D%2218%22%20text-anchor%3D%22middle%22%20x%3D%22126.5%22%20y%3D%22188%22%3E08%3C%2Ftext%3E%3Ctext%20fill%3D%22%23ED4850%22%20font-family%3D%22math131bfb6193d36794f7db8079364%22%20font-size%3D%2216%22%20text-anchor%3D%22middle%22%20x%3D%22143.5%22%20y%3D%22188%22%3E%26%23x2212%3B%3C%2Ftext%3E%3Ctext%20fill%3D%22%23ED4850%22%20font-family%3D%22Times%20New%20Roman%22%20font-size%3D%2218%22%20text-anchor%3D%22middle%22%20x%3D%22161.5%22%20y%3D%22188%22%3E37%3C%2Ftext%3E%3Ctext%20fill%3D%22%23ED4850%22%20font-family%3D%22math131bfb6193d36794f7db8079364%22%20font-size%3D%2216%22%20text-anchor%3D%22middle%22%20x%3D%22172.5%22%20y%3D%22188%22%3E.%3C%2Ftext%3E%3Ctext%20fill%3D%22%23ED4850%22%20font-family%3D%22Times%20New%20Roman%22%20font-size%3D%2218%22%20text-anchor%3D%22middle%22%20x%3D%22184.5%22%20y%3D%22188%22%3E44%3C%2Ftext%3E%3Ctext%20fill%3D%22%23ED4850%22%20font-family%3D%22math131bfb6193d36794f7db8079364%22%20font-size%3D%2216%22%20text-anchor%3D%22middle%22%20x%3D%22201.5%22%20y%3D%22188%22%3E%3D%3C%2Ftext%3E%3Ctext%20fill%3D%22%23ED4850%22%20font-family%3D%22Times%20New%20Roman%22%20font-size%3D%2218%22%20text-anchor%3D%22middle%22%20x%3D%22214.5%22%20y%3D%22188%22%3E3%3C%2Ftext%3E%3Ctext%20fill%3D%22%23ED4850%22%20font-family%3D%22math131bfb6193d36794f7db8079364%22%20font-size%3D%2216%22%20text-anchor%3D%22middle%22%20x%3D%22221.5%22%20y%3D%22188%22%3E.%3C%2Ftext%3E%3Ctext%20fill%3D%22%23ED4850%22%20font-family%3D%22Times%20New%20Roman%22%20font-size%3D%2218%22%20text-anchor%3D%22middle%22%20x%3D%22233.5%22%20y%3D%22188%22%3E64%3C%2Ftext%3E%3Ctext%20fill%3D%22%23ED4850%22%20font-family%3D%22Times%20New%20Roman%22%20font-size%3D%2218%22%20font-style%3D%22italic%22%20text-anchor%3D%22middle%22%20x%3D%2271.5%22%20y%3D%22214%22%3Eh%3C%2Ftext%3E%3Ctext%20fill%3D%22%23ED4850%22%20font-family%3D%22math131bfb6193d36794f7db8079364%22%20font-size%3D%2216%22%20text-anchor%3D%22middle%22%20x%3D%2285.5%22%20y%3D%22214%22%3E%3D%3C%2Ftext%3E%3Ctext%20fill%3D%22%23ED4850%22%20font-family%3D%22Times%20New%20Roman%22%20font-size%3D%2218%22%20text-anchor%3D%22middle%22%20x%3D%2298.5%22%20y%3D%22214%22%3E1%3C%2Ftext%3E%3Ctext%20fill%3D%22%23ED4850%22%20font-family%3D%22math131bfb6193d36794f7db8079364%22%20font-size%3D%2216%22%20text-anchor%3D%22middle%22%20x%3D%22105.5%22%20y%3D%22214%22%3E.%3C%2Ftext%3E%3Ctext%20fill%3D%22%23ED4850%22%20font-family%3D%22Times%20New%20Roman%22%20font-size%3D%2218%22%20text-anchor%3D%22middle%22%20x%3D%22117.5%22%20y%3D%22214%22%3E82%3C%2Ftext%3E%3C%2Fsvg%3E)
Both new students have a height of 1.82 metres
Mode, Median & Mean from Tables & Charts
How can I find averages if there are lots of values?
In the real world there will usually be more data to deal with than just a few numbers
The data can be organised in a way that makes it easier understand
For example in a table or chart
We can still find the mean, median and mode
But we have to understand what the table or chart is telling us
Be careful - we are not talking here about tables for grouped data
In a grouped data table, the individual data values are no longer available
See the 'Mode & Mean from Grouped Data' and 'Linear Interpolation' revision notes
The tables discussed in this note give the frequencies for each data value
That means the entire original data set is still available
How do I find averages from a table or chart?
Finding the median and mode from tables/charts is fairly straightforward once you understand what the table/chart is telling you
Tables allow data to be summarised neatly
and (quite usefully!) they put the data into order
The instructions here show how to find averages from tables
For charts it is often easiest to turn the chart into a table first
See the Worked Example
But you can use the same methods directly from a chart if you feel confident doing so
Finding the mean from (discrete) data presented in tables
Tables tell us
the data value
e.g. the number of pets per household
and the frequency of that data value
i.e., how many times that data value occurred
e.g. the number of households with that number of pets
STEP 1
Add a column to the table and work out "data value" × "frequency"This is doing the 'adding up' part of finding the mean
We're just doing it one data value at a time
STEP 2
Find the total of the extra column to give the overall total of the data valuesSTEP 3
Find the mean by dividing this total by the total of the frequency columni.e. divide the total of the data values by the number of data values
Finding the median from (discrete) data presented in tables
The median is the middle value when the data is in order
The position of the median can be found by using
, where  is the number of data values
e.g. if
, then The median is the 18th value
Or if
format('truetype')%3Bfont-weight%3Anormal%3Bfont-style%3Anormal%3B%7D%3C%2Fstyle%3E%3C%2Fdefs%3E%3Ctext%20font-family%3D%22Times%20New%20Roman%22%20font-size%3D%2218%22%20font-style%3D%22italic%22%20text-anchor%3D%22middle%22%20x%3D%224.5%22%20y%3D%2216%22%3En%3C%2Ftext%3E%3Ctext%20font-family%3D%22math17f39f8317fbdb1988ef4c628eb%22%20font-size%3D%2216%22%20text-anchor%3D%22middle%22%20x%3D%2218.5%22%20y%3D%2216%22%3E%3D%3C%2Ftext%3E%3Ctext%20font-family%3D%22Times%20New%20Roman%22%20font-size%3D%2218%22%20text-anchor%3D%22middle%22%20x%3D%2236.5%22%20y%3D%2216%22%3E48%3C%2Ftext%3E%3C%2Fsvg%3E) , then
, then format('truetype')%3Bfont-weight%3Anormal%3Bfont-style%3Anormal%3B%7D%3C%2Fstyle%3E%3C%2Fdefs%3E%3Cline%20stroke%3D%22%23000000%22%20stroke-linecap%3D%22square%22%20stroke-width%3D%221%22%20x1%3D%222.5%22%20x2%3D%2241.5%22%20y1%3D%2223.5%22%20y2%3D%2223.5%22%2F%3E%3Ctext%20font-family%3D%22Times%20New%20Roman%22%20font-size%3D%2218%22%20font-style%3D%22italic%22%20text-anchor%3D%22middle%22%20x%3D%228.5%22%20y%3D%2216%22%3En%3C%2Ftext%3E%3Ctext%20font-family%3D%22math105e3f444b77fd674ead956ad23%22%20font-size%3D%2216%22%20text-anchor%3D%22middle%22%20x%3D%2222.5%22%20y%3D%2216%22%3E%2B%3C%2Ftext%3E%3Ctext%20font-family%3D%22Times%20New%20Roman%22%20font-size%3D%2218%22%20text-anchor%3D%22middle%22%20x%3D%2235.5%22%20y%3D%2216%22%3E1%3C%2Ftext%3E%3Ctext%20font-family%3D%22Times%20New%20Roman%22%20font-size%3D%2218%22%20text-anchor%3D%22middle%22%20x%3D%2222.5%22%20y%3D%2241%22%3E2%3C%2Ftext%3E%3Ctext%20font-family%3D%22math105e3f444b77fd674ead956ad23%22%20font-size%3D%2216%22%20text-anchor%3D%22middle%22%20x%3D%2252.5%22%20y%3D%2230%22%3E%3D%3C%2Ftext%3E%3Cline%20stroke%3D%22%23000000%22%20stroke-linecap%3D%22square%22%20stroke-width%3D%221%22%20x1%3D%2263.5%22%20x2%3D%22110.5%22%20y1%3D%2223.5%22%20y2%3D%2223.5%22%2F%3E%3Ctext%20font-family%3D%22Times%20New%20Roman%22%20font-size%3D%2218%22%20text-anchor%3D%22middle%22%20x%3D%2274.5%22%20y%3D%2216%22%3E48%3C%2Ftext%3E%3Ctext%20font-family%3D%22math105e3f444b77fd674ead956ad23%22%20font-size%3D%2216%22%20text-anchor%3D%22middle%22%20x%3D%2291.5%22%20y%3D%2216%22%3E%2B%3C%2Ftext%3E%3Ctext%20font-family%3D%22Times%20New%20Roman%22%20font-size%3D%2218%22%20text-anchor%3D%22middle%22%20x%3D%22104.5%22%20y%3D%2216%22%3E1%3C%2Ftext%3E%3Ctext%20font-family%3D%22Times%20New%20Roman%22%20font-size%3D%2218%22%20text-anchor%3D%22middle%22%20x%3D%2287.5%22%20y%3D%2241%22%3E2%3C%2Ftext%3E%3Ctext%20font-family%3D%22math105e3f444b77fd674ead956ad23%22%20font-size%3D%2216%22%20text-anchor%3D%22middle%22%20x%3D%22121.5%22%20y%3D%2230%22%3E%3D%3C%2Ftext%3E%3Ctext%20font-family%3D%22Times%20New%20Roman%22%20font-size%3D%2218%22%20text-anchor%3D%22middle%22%20x%3D%22139.5%22%20y%3D%2230%22%3E24%3C%2Ftext%3E%3Ctext%20font-family%3D%22math105e3f444b77fd674ead956ad23%22%20font-size%3D%2216%22%20text-anchor%3D%22middle%22%20x%3D%22150.5%22%20y%3D%2230%22%3E.%3C%2Ftext%3E%3Ctext%20font-family%3D%22Times%20New%20Roman%22%20font-size%3D%2218%22%20text-anchor%3D%22middle%22%20x%3D%22157.5%22%20y%3D%2230%22%3E5%3C%2Ftext%3E%3C%2Fsvg%3E)
The median is midway between the 24th and 25th data values
Use the table to deduce where the
format('truetype')%3Bfont-weight%3Anormal%3Bfont-style%3Anormal%3B%7D%40font-face%7Bfont-family%3A'brack_sm2882ad605b1e27be87c7468'%3Bsrc%3Aurl(data%3Afont%2Ftruetype%3Bcharset%3Dutf-8%3Bbase64%2CAAEAAAAMAIAAAwBAT1MvMi7PH4UAAADMAAAATmNtYXA3kjw6AAABHAAAADxjdnQgAQYDiAAAAVgAAAASZ2x5ZkyYQ7YAAAFsAAAAkWhlYWQLyR8fAAACAAAAADZoaGVhAq0XCAAAAjgAAAAkaG10eDEjA%2FUAAAJcAAAADGxvY2EAAEKZAAACaAAAABBtYXhwBJsEcQAAAngAAAAgbmFtZW7QvZAAAAKYAAAB5XBvc3QArQBVAAAEgAAAACBwcmVwu5WEAAAABKAAAAAHAAACDAGQAAUAAAQABAAAAAAABAAEAAAAAAAAAQEAAAAAAAAAAAAAAAAAAAAAAAAAAAAAAAAAAAAAACAgICAAAAAg9AMD%2FP%2F8AAABVAABAAAAAAACAAEAAQAAABQAAwABAAAAFAAEACgAAAAGAAQAAQACI5wjn%2F%2F%2FAAAjnCOf%2F%2F%2FcZdxjAAEAAAAAAAAAAAFUAFQBAAArAIwAgACoAAcAAAACAAAAAADVAQEAAwAHAAAxMxEjFyM1M9XVq4CAAQHWqwABAAAAAABVAVgAAwAfGAGwAy%2BwADyxAgL1sAE8ALEDAD%2BwAjx8sQAG9bABPBEzESNVVQFY%2FqgAAQDXAAABLAFUAAMAIBgBsAUvsAE8sAI8sQAC9bADPACwAy%2BwAjyxAAH1sAE8EzMRI9dVVQFU%2FqwAAAAAAQAAAAEAAIsesexfDzz1AAMEAP%2F%2F%2F%2F%2FVre5k%2F%2F%2F%2F%2F9Wt7mT%2FgP%2F%2FAdYBWAAAAAoAAgABAAAAAAABAAABVP%2F%2FAAAXcP%2BA%2F4AB1gABAAAAAAAAAAAAAAAAAAAAAwDVAAABLAAAASwA1wAAAAAAAAAhAAAAWAAAAJEAAQAAAAMACgACAAAAAAACAIAEAAAAAAAEAABlAAAAAAAAABUBAgAAAAAAAAABACYAAAAAAAAAAAACAA4AJgAAAAAAAAADAEQANAAAAAAAAAAEACYAeAAAAAAAAAAFABYAngAAAAAAAAAGABMAtAAAAAAAAAAIABwAxwABAAAAAAABACYAAAABAAAAAAACAA4AJgABAAAAAAADAEQANAABAAAAAAAEACYAeAABAAAAAAAFABYAngABAAAAAAAGABMAtAABAAAAAAAIABwAxwADAAEECQABACYAAAADAAEECQACAA4AJgADAAEECQADAEQANAADAAEECQAEACYAeAADAAEECQAFABYAngADAAEECQAGABMAtAADAAEECQAIABwAxwBCAHIAYQBjAGsAZQB0AHMAIABzAG0AYQBsAGwAIABzAGkAegBlAFIAZQBnAHUAbABhAHIATQBhAHQAaABzACAARgBvAHIAIABNAG8AcgBlACAAQgByAGEAYwBrAGUAdABzACAAcwBtAGEAbABsACAAcwBpAHoAZQBCAHIAYQBjAGsAZQB0AHMAIABzAG0AYQBsAGwAIABzAGkAegBlAFYAZQByAHMAaQBvAG4AIAAyAC4AMEJyYWNrZXRzX3NtYWxsX3NpemUATQBhAHQAaABzACAARgBvAHIAIABNAG8AcgBlAAAAAAMAAAAAAAAAqgBVAAAAAAAAAAAAAAAAAAAAAAAAAAC5B%2F8AAo2FAA%3D%3D)format('truetype')%3Bfont-weight%3Anormal%3Bfont-style%3Anormal%3B%7D%40font-face%7Bfont-family%3A'bracketse552f5417ff4680c6b50499'%3Bsrc%3Aurl(data%3Afont%2Ftruetype%3Bcharset%3Dutf-8%3Bbase64%2CAAEAAAAMAIAAAwBAT1MvMi7RIisAAADMAAAATmNtYXBi7uzYAAABHAAAAExjdnQgBAkDLgAAAWgAAAASZ2x5Zo64f%2BkAAAF8AAABSWhlYWQLniGcAAACyAAAADZoaGVhBK4XLAAAAwAAAAAkaG10eCWq%2F90AAAMkAAAAFGxvY2EAABknAAADOAAAABhtYXhwBJIESAAAA1AAAAAgbmFtZRAA8I4AAANwAAAB3nBvc3QBwwDgAAAFUAAAACBwcmVwupWEAAAABXAAAAAHAAACggGQAAUAAAQABAAAAAAABAAEAAAAAAAAAQEAAAAAAAAAAAAAAAAAAAAAAAAAAAAAAAAAAAAAACAgICAAAAAg9AMEAAAAAAADgAAAAAAAAAACAAEAAQAAABQAAwABAAAAFAAEADgAAAAKAAgAAgACI5sjnSOeI6D%2F%2FwAAI5sjnSOeI6D%2F%2F9xm3GXcZdxkAAEAAAAAAAAAAAAAAAABVABWAQAALACoA4AAMgAHAAAAAgAAACoA1QNVAAMABwAANTMRIxMjETPV1auAgCoDK%2F0AAtUAAQAAAAABgAOAAAUAJBgBsAAvsAPFsQEC%2FbADELEEBP0AsQAAP7ABPLEEBj%2BwAzwwMTEzEAEjAFUBKyv%2BqwH8AYT%2BqgABAAAAAAGAA4AABQAmGAGwAC6wA8WxBQL9sAMQsQIE%2FQB8sQAGPxiwBTyxAwb2sAI8MDEREgEzABMBAVQr%2FtMCA4D91v6qAYQB%2FAAB%2F6wAAAEsA4AABQAnGAGwAC%2BwBzywA8WxAQL9sAMQsQQE%2FQCxAAA%2FsAE8sQQGP7ADPDAxISMSATMAASxVAf7UKwFVAfwBhP6rAAH%2FrAAAASwDgAAFACkYAbABL7AHPLAExbEAAv2wBBCxAwT9AHyxAQY%2FsAA8GLEEAD%2BwAzwwMRMzEAEjANdV%2FqsrASsDgP3V%2FqsBhgAAAAABAAAAAQAAeuTcpl8PPPUAAwQA%2F%2F%2F%2F%2F9Wt7o7%2F%2F%2F%2F%2F1a3ujv%2BsAAABgAOAAAAACgACAAEAAAAAAAEAAAOAAAAAABdw%2F6z%2FrAGAAAEAAAAAAAAAAAAAAAAAAAAFANUAAAEsAAABLAAAASz%2FrAEs%2F6wAAAAAAAAAJAAAAGgAAACzAAAA%2FQAAAUkAAQAAAAUACAACAAAAAAACAIAEAAAAAAAEAAA%2BAAAAAAAAABUBAgAAAAAAAAABACQAAAAAAAAAAAACAA4AJAAAAAAAAAADAEIAMgAAAAAAAAAEACQAdAAAAAAAAAAFABYAmAAAAAAAAAAGABIArgAAAAAAAAAIABwAwAABAAAAAAABACQAAAABAAAAAAACAA4AJAABAAAAAAADAEIAMgABAAAAAAAEACQAdAABAAAAAAAFABYAmAABAAAAAAAGABIArgABAAAAAAAIABwAwAADAAEECQABACQAAAADAAEECQACAA4AJAADAAEECQADAEIAMgADAAEECQAEACQAdAADAAEECQAFABYAmAADAAEECQAGABIArgADAAEECQAIABwAwABCAHIAYQBjAGsAZQB0AHMAIABmAHUAbABsACAAcwBpAHoAZQBSAGUAZwB1AGwAYQByAE0AYQB0AGgAcwAgAEYAbwByACAATQBvAHIAZQAgAEIAcgBhAGMAawBlAHQAcwAgAGYAdQBsAGwAIABzAGkAegBlAEIAcgBhAGMAawBlAHQAcwAgAGYAdQBsAGwAIABzAGkAegBlAFYAZQByAHMAaQBvAG4AIAAyAC4AMEJyYWNrZXRzX2Z1bGxfc2l6ZQBNAGEAdABoAHMAIABGAG8AcgAgAE0AbwByAGUAAAADAAAAAAAAAcAA4AAAAAAAAAAAAAAAAAAAAAAAAAAAuQf%2FAAGNhQA%3D)format('truetype')%3Bfont-weight%3Anormal%3Bfont-style%3Anormal%3B%7D%3C%2Fstyle%3E%3C%2Fdefs%3E%3Ctext%20font-family%3D%22bracketse552f5417ff4680c6b50499%22%20font-size%3D%2218%22%20text-anchor%3D%22start%22%20x%3D%221.5%22%20y%3D%2217%22%3E%26%23x239B%3B%3C%2Ftext%3E%3Ctext%20font-family%3D%22brack_sm2882ad605b1e27be87c7468%22%20font-size%3D%2218%22%20text-anchor%3D%22start%22%20x%3D%221.5%22%20y%3D%2223%22%3E%26%23x239C%3B%3C%2Ftext%3E%3Ctext%20font-family%3D%22brack_sm2882ad605b1e27be87c7468%22%20font-size%3D%2218%22%20text-anchor%3D%22start%22%20x%3D%221.5%22%20y%3D%2229%22%3E%26%23x239C%3B%3C%2Ftext%3E%3Ctext%20font-family%3D%22bracketse552f5417ff4680c6b50499%22%20font-size%3D%2218%22%20text-anchor%3D%22start%22%20x%3D%221.5%22%20y%3D%2245%22%3E%26%23x239D%3B%3C%2Ftext%3E%3Ctext%20font-family%3D%22bracketse552f5417ff4680c6b50499%22%20font-size%3D%2218%22%20text-anchor%3D%22start%22%20x%3D%2252.5%22%20y%3D%2217%22%3E%26%23x239E%3B%3C%2Ftext%3E%3Ctext%20font-family%3D%22brack_sm2882ad605b1e27be87c7468%22%20font-size%3D%2218%22%20text-anchor%3D%22start%22%20x%3D%2252.5%22%20y%3D%2223%22%3E%26%23x239F%3B%3C%2Ftext%3E%3Ctext%20font-family%3D%22brack_sm2882ad605b1e27be87c7468%22%20font-size%3D%2218%22%20text-anchor%3D%22start%22%20x%3D%2252.5%22%20y%3D%2229%22%3E%26%23x239F%3B%3C%2Ftext%3E%3Ctext%20font-family%3D%22bracketse552f5417ff4680c6b50499%22%20font-size%3D%2218%22%20text-anchor%3D%22start%22%20x%3D%2252.5%22%20y%3D%2245%22%3E%26%23x23A0%3B%3C%2Ftext%3E%3Cline%20stroke%3D%22%23000000%22%20stroke-linecap%3D%22square%22%20stroke-width%3D%221%22%20x1%3D%229.5%22%20x2%3D%2248.5%22%20y1%3D%2223.5%22%20y2%3D%2223.5%22%2F%3E%3Ctext%20font-family%3D%22Times%20New%20Roman%22%20font-size%3D%2218%22%20font-style%3D%22italic%22%20text-anchor%3D%22middle%22%20x%3D%2215.5%22%20y%3D%2216%22%3En%3C%2Ftext%3E%3Ctext%20font-family%3D%22math117e62166fc8586dfa4d1bc0e17%22%20font-size%3D%2216%22%20text-anchor%3D%22middle%22%20x%3D%2229.5%22%20y%3D%2216%22%3E%2B%3C%2Ftext%3E%3Ctext%20font-family%3D%22Times%20New%20Roman%22%20font-size%3D%2218%22%20text-anchor%3D%22middle%22%20x%3D%2242.5%22%20y%3D%2216%22%3E1%3C%2Ftext%3E%3Ctext%20font-family%3D%22Times%20New%20Roman%22%20font-size%3D%2218%22%20text-anchor%3D%22middle%22%20x%3D%2229.5%22%20y%3D%2241%22%3E2%3C%2Ftext%3E%3Ctext%20font-family%3D%22Times%20New%20Roman%22%20font-size%3D%2213%22%20text-anchor%3D%22middle%22%20x%3D%2263.5%22%20y%3D%2212%22%3Eth%3C%2Ftext%3E%3C%2Fsvg%3E) value lies
value liese.g. if the median is the 7th value
and the frequency of the first two rows are 4 and 9
then the median will be one of the 9 values in the second row of that table
Finding the mode (or modal value)
The mode (or modal value) is simple to identify
Look for the highest frequency
i.e. the data value that occurs the most times
The corresponding data value is the mode
Make sure you do not confuse the data value with the frequency!
Worked Example
The bar chart shows data about the shoe sizes of pupils in class 11A.
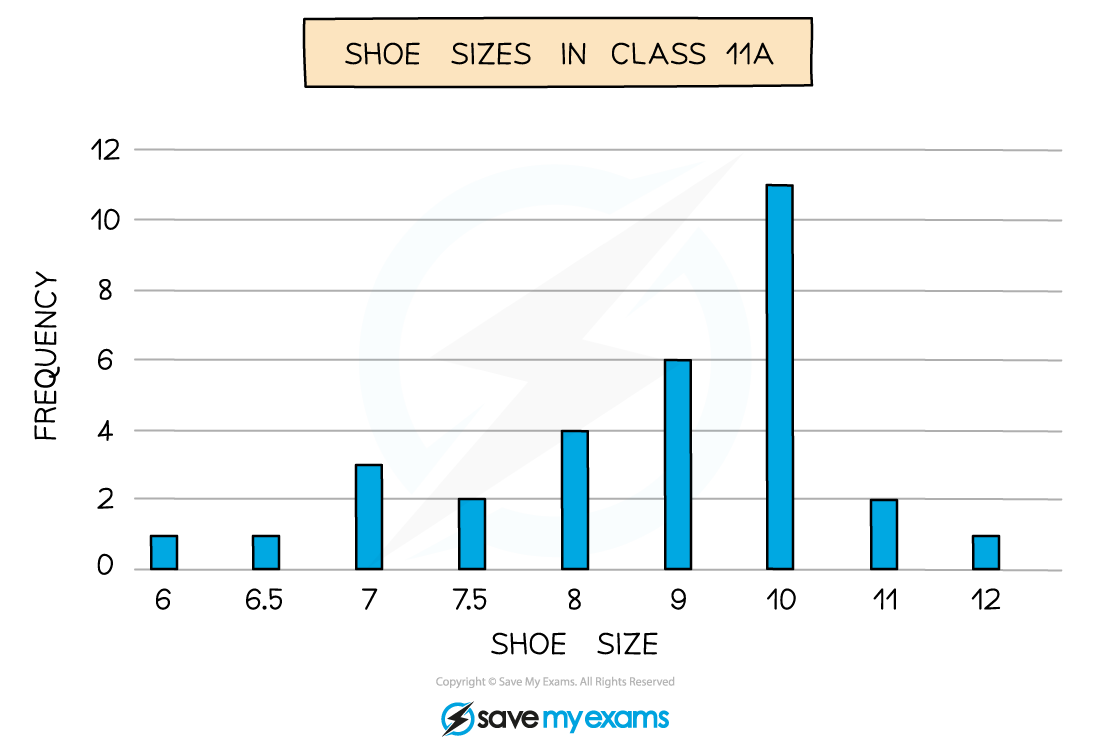
(a) Find the mean shoe size for the class,
It will be easiest here to rewrite the data as a table
Add an extra column to help find the total of all the shoe size values
Shoe size (x ) | Frequency (f ) | xf |
6 | 1 | 6 × 1 = 6 |
6.5 | 1 | 6.5 × 1 = 6.5 |
7 | 3 | 7 × 3 = 21 |
7.5 | 2 | 7.5 × 2 = 15 |
8 | 4 | 8 × 4 = 32 |
9 | 6 | 9 × 6 = 54 |
10 | 11 | 10 × 11 = 110 |
11 | 2 | 11 × 2 = 22 |
12 | 1 | 12 × 1 = 12 |
Total | 31 | 278.5 |
Mean format('truetype')%3Bfont-weight%3Anormal%3Bfont-style%3Anormal%3B%7D%3C%2Fstyle%3E%3C%2Fdefs%3E%3Ctext%20fill%3D%22%23ED4850%22%20font-family%3D%22math11824c643d1feb4da18b28ed527%22%20font-size%3D%2216%22%20text-anchor%3D%22middle%22%20x%3D%228.5%22%20y%3D%2230%22%3E%3D%3C%2Ftext%3E%3Cline%20stroke%3D%22%23ED4850%22%20stroke-linecap%3D%22square%22%20stroke-width%3D%221%22%20x1%3D%2219.5%22%20x2%3D%2263.5%22%20y1%3D%2223.5%22%20y2%3D%2223.5%22%2F%3E%3Ctext%20fill%3D%22%23ED4850%22%20font-family%3D%22Times%20New%20Roman%22%20font-size%3D%2218%22%20text-anchor%3D%22middle%22%20x%3D%2234.5%22%20y%3D%2216%22%3E278%3C%2Ftext%3E%3Ctext%20fill%3D%22%23ED4850%22%20font-family%3D%22math11824c643d1feb4da18b28ed527%22%20font-size%3D%2216%22%20text-anchor%3D%22middle%22%20x%3D%2250.5%22%20y%3D%2216%22%3E.%3C%2Ftext%3E%3Ctext%20fill%3D%22%23ED4850%22%20font-family%3D%22Times%20New%20Roman%22%20font-size%3D%2218%22%20text-anchor%3D%22middle%22%20x%3D%2257.5%22%20y%3D%2216%22%3E5%3C%2Ftext%3E%3Ctext%20fill%3D%22%23ED4850%22%20font-family%3D%22Times%20New%20Roman%22%20font-size%3D%2218%22%20text-anchor%3D%22middle%22%20x%3D%2242.5%22%20y%3D%2241%22%3E31%3C%2Ftext%3E%3Ctext%20fill%3D%22%23ED4850%22%20font-family%3D%22math11824c643d1feb4da18b28ed527%22%20font-size%3D%2216%22%20text-anchor%3D%22middle%22%20x%3D%2274.5%22%20y%3D%2230%22%3E%3D%3C%2Ftext%3E%3Ctext%20fill%3D%22%23ED4850%22%20font-family%3D%22Times%20New%20Roman%22%20font-size%3D%2218%22%20text-anchor%3D%22middle%22%20x%3D%2287.5%22%20y%3D%2230%22%3E8%3C%2Ftext%3E%3Ctext%20fill%3D%22%23ED4850%22%20font-family%3D%22math11824c643d1feb4da18b28ed527%22%20font-size%3D%2216%22%20text-anchor%3D%22middle%22%20x%3D%2294.5%22%20y%3D%2230%22%3E.%3C%2Ftext%3E%3Ctext%20fill%3D%22%23ED4850%22%20font-family%3D%22Times%20New%20Roman%22%20font-size%3D%2218%22%20text-anchor%3D%22middle%22%20x%3D%22110.5%22%20y%3D%2230%22%3E983%3C%2Ftext%3E%3Ctext%20fill%3D%22%23ED4850%22%20font-family%3D%22Times%20New%20Roman%22%20font-size%3D%2218%22%20text-anchor%3D%22middle%22%20x%3D%22141.5%22%20y%3D%2230%22%3E870%3C%2Ftext%3E%3Ctext%20fill%3D%22%23ED4850%22%20font-family%3D%22math11824c643d1feb4da18b28ed527%22%20font-size%3D%2216%22%20text-anchor%3D%22middle%22%20x%3D%22161.5%22%20y%3D%2230%22%3E.%3C%2Ftext%3E%3Ctext%20fill%3D%22%23ED4850%22%20font-family%3D%22math11824c643d1feb4da18b28ed527%22%20font-size%3D%2216%22%20text-anchor%3D%22middle%22%20x%3D%22166.5%22%20y%3D%2230%22%3E.%3C%2Ftext%3E%3Ctext%20fill%3D%22%23ED4850%22%20font-family%3D%22math11824c643d1feb4da18b28ed527%22%20font-size%3D%2216%22%20text-anchor%3D%22middle%22%20x%3D%22171.5%22%20y%3D%2230%22%3E.%3C%2Ftext%3E%3C%2Fsvg%3E)
Mean = 8.98 (3 s.f.)
Note that the mean does not have to be an actual shoe size
(b) Find the median shoe size,
The bar chart/table has the data in order already
So we just need to find the position of the median
format('truetype')%3Bfont-weight%3Anormal%3Bfont-style%3Anormal%3B%7D%3C%2Fstyle%3E%3C%2Fdefs%3E%3Cline%20stroke%3D%22%23ED4850%22%20stroke-linecap%3D%22square%22%20stroke-width%3D%221%22%20x1%3D%222.5%22%20x2%3D%2241.5%22%20y1%3D%2223.5%22%20y2%3D%2223.5%22%2F%3E%3Ctext%20fill%3D%22%23ED4850%22%20font-family%3D%22Times%20New%20Roman%22%20font-size%3D%2218%22%20font-style%3D%22italic%22%20text-anchor%3D%22middle%22%20x%3D%228.5%22%20y%3D%2216%22%3En%3C%2Ftext%3E%3Ctext%20fill%3D%22%23ED4850%22%20font-family%3D%22math12ed72e0d2d50af08c235c494fe%22%20font-size%3D%2216%22%20text-anchor%3D%22middle%22%20x%3D%2222.5%22%20y%3D%2216%22%3E%2B%3C%2Ftext%3E%3Ctext%20fill%3D%22%23ED4850%22%20font-family%3D%22Times%20New%20Roman%22%20font-size%3D%2218%22%20text-anchor%3D%22middle%22%20x%3D%2235.5%22%20y%3D%2216%22%3E1%3C%2Ftext%3E%3Ctext%20fill%3D%22%23ED4850%22%20font-family%3D%22Times%20New%20Roman%22%20font-size%3D%2218%22%20text-anchor%3D%22middle%22%20x%3D%2222.5%22%20y%3D%2241%22%3E2%3C%2Ftext%3E%3Ctext%20fill%3D%22%23ED4850%22%20font-family%3D%22math12ed72e0d2d50af08c235c494fe%22%20font-size%3D%2216%22%20text-anchor%3D%22middle%22%20x%3D%2252.5%22%20y%3D%2230%22%3E%3D%3C%2Ftext%3E%3Cline%20stroke%3D%22%23ED4850%22%20stroke-linecap%3D%22square%22%20stroke-width%3D%221%22%20x1%3D%2263.5%22%20x2%3D%22110.5%22%20y1%3D%2223.5%22%20y2%3D%2223.5%22%2F%3E%3Ctext%20fill%3D%22%23ED4850%22%20font-family%3D%22Times%20New%20Roman%22%20font-size%3D%2218%22%20text-anchor%3D%22middle%22%20x%3D%2274.5%22%20y%3D%2216%22%3E31%3C%2Ftext%3E%3Ctext%20fill%3D%22%23ED4850%22%20font-family%3D%22math12ed72e0d2d50af08c235c494fe%22%20font-size%3D%2216%22%20text-anchor%3D%22middle%22%20x%3D%2291.5%22%20y%3D%2216%22%3E%2B%3C%2Ftext%3E%3Ctext%20fill%3D%22%23ED4850%22%20font-family%3D%22Times%20New%20Roman%22%20font-size%3D%2218%22%20text-anchor%3D%22middle%22%20x%3D%22104.5%22%20y%3D%2216%22%3E1%3C%2Ftext%3E%3Ctext%20fill%3D%22%23ED4850%22%20font-family%3D%22Times%20New%20Roman%22%20font-size%3D%2218%22%20text-anchor%3D%22middle%22%20x%3D%2287.5%22%20y%3D%2241%22%3E2%3C%2Ftext%3E%3Ctext%20fill%3D%22%23ED4850%22%20font-family%3D%22math12ed72e0d2d50af08c235c494fe%22%20font-size%3D%2216%22%20text-anchor%3D%22middle%22%20x%3D%22121.5%22%20y%3D%2230%22%3E%3D%3C%2Ftext%3E%3Cline%20stroke%3D%22%23ED4850%22%20stroke-linecap%3D%22square%22%20stroke-width%3D%221%22%20x1%3D%22132.5%22%20x2%3D%22153.5%22%20y1%3D%2223.5%22%20y2%3D%2223.5%22%2F%3E%3Ctext%20fill%3D%22%23ED4850%22%20font-family%3D%22Times%20New%20Roman%22%20font-size%3D%2218%22%20text-anchor%3D%22middle%22%20x%3D%22143.5%22%20y%3D%2216%22%3E32%3C%2Ftext%3E%3Ctext%20fill%3D%22%23ED4850%22%20font-family%3D%22Times%20New%20Roman%22%20font-size%3D%2218%22%20text-anchor%3D%22middle%22%20x%3D%22143.5%22%20y%3D%2241%22%3E2%3C%2Ftext%3E%3Ctext%20fill%3D%22%23ED4850%22%20font-family%3D%22math12ed72e0d2d50af08c235c494fe%22%20font-size%3D%2216%22%20text-anchor%3D%22middle%22%20x%3D%22164.5%22%20y%3D%2230%22%3E%3D%3C%2Ftext%3E%3Ctext%20fill%3D%22%23ED4850%22%20font-family%3D%22Times%20New%20Roman%22%20font-size%3D%2218%22%20text-anchor%3D%22middle%22%20x%3D%22182.5%22%20y%3D%2230%22%3E16%3C%2Ftext%3E%3C%2Fsvg%3E)
The median is the 16th value
There are 1 + 1 + 3 + 2 + 4 = 11 values in the first five rows of the table
There are 11 + 6 = 17 values in the first six rows of the table
Therefore the 16th value must be in the sixth row
Median shoe size is 9
(c) Suggest a reason the shop owner may wish to know the modal shoe size of the shop's customers.
The modal size will be more likely to sell than other sizes, so the shop owner should order more shoes in the modal size to stock the shop with.

You've read 0 of your 0 free revision notes
Get unlimited access
to absolutely everything:
- Downloadable PDFs
- Unlimited Revision Notes
- Topic Questions
- Past Papers
- Model Answers
- Videos (Maths and Science)
Did this page help you?