
Structure of Ecosystems
Nature of ecosystems
- These are open systems, as flows of energy and materials cross ecosystem boundaries
- The system is dynamic and works in balance - if one part changes, it changes the characteristics of the whole ecosystem or environment it is in
- They are considered a community of living (biotic - plants and animals) and non-living (abiotic) elements, that interact and work together in the same environment
- The physical environment provides energy, living space and nutrients that flora and fauna need to survive
- Ecosystems can exist at any scale from a biome to a puddle
- Feedback loops exist within the systems, e.g.
- Germinating seeds increases the number of plants
- Biomass increases, which increases the number of seeds etc.
- Positive feedback
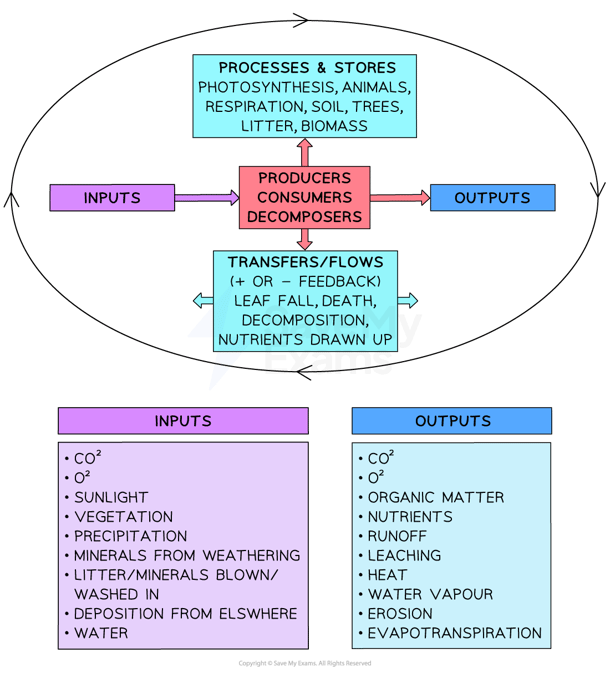
Inputs and outputs of an open ecosystem
Structure
- Biotic factors include:
- Producers - autotrophs - organisms that create energy from inorganic matter. Most are phototrophic (they create energy through photosynthesis)
- Consumers - called heterotrophs as they don't make their own food but rely on producers
- There are four groups:
- Primary - these are herbivores (eat only plants) and feed on producers
- Secondary - primary/small carnivores(eat only meat) and feed on herbivores
- Tertiary - large carnivores that feed on primary carnivores
- Quaternary - omnivores eat both meat and plant
- There are four groups:
- Decomposers - break down dead organic matter and release it into the environment
- Saprophytes - organisms that feed on dead or decaying matter – bacteria, fungi
- Detritivores – animals which eats detritus – fragments of dead and decaying matter
- Abiotic factors:
- Climatic
- Insolation
- Precipitation
- Wind
- Temperature
- Altitude/latitude
- Physical
- Topography
- Altitude/Latitude
- Water quality
- Soil (edaphic) properties
- Texture
- pH of the soil
- Mineral content
- Organic matter content
- Water content/quality
- Climatic
Exam Tip
Examiners are looking for you to be able to identify the interconnections between abiotic and biotic components, which is the foundation of understanding the impacts and responses to changes in an ecosystems
It is also important to consider that limiting factors are not always due to human activity and include abiotic factors such as:
- Sunlight
- Precipitation
- Temperature
- Relief (slope)
- Drainage
- Soils
- Climate – weather, altitude and latitude

format('truetype')%3Bfont-weight%3Anormal%3Bfont-style%3Anormal%3B%7D%3C%2Fstyle%3E%3C%2Fdefs%3E%3Cline%20stroke%3D%22%23000000%22%20stroke-linecap%3D%22square%22%20stroke-width%3D%221%22%20x1%3D%222.5%22%20x2%3D%22651.5%22%20y1%3D%2225.5%22%20y2%3D%2225.5%22%2F%3E%3Ctext%20font-family%3D%22Times%20New%20Roman%22%20font-size%3D%2220%22%20font-weight%3D%22bold%22%20text-anchor%3D%22middle%22%20x%3D%2210.5%22%20y%3D%2218%22%3En%3C%2Ftext%3E%3Ctext%20font-family%3D%22Times%20New%20Roman%22%20font-size%3D%2220%22%20font-weight%3D%22bold%22%20text-anchor%3D%22middle%22%20x%3D%2221.5%22%20y%3D%2218%22%3Ee%3C%2Ftext%3E%3Ctext%20font-family%3D%22Times%20New%20Roman%22%20font-size%3D%2220%22%20font-weight%3D%22bold%22%20text-anchor%3D%22middle%22%20x%3D%2229.5%22%20y%3D%2218%22%3Et%3C%2Ftext%3E%3Ctext%20font-family%3D%22Times%20New%20Roman%22%20font-size%3D%2220%22%20font-weight%3D%22bold%22%20text-anchor%3D%22middle%22%20x%3D%2244.5%22%20y%3D%2218%22%3Ep%3C%2Ftext%3E%3Ctext%20font-family%3D%22Times%20New%20Roman%22%20font-size%3D%2220%22%20font-weight%3D%22bold%22%20text-anchor%3D%22middle%22%20x%3D%2254.5%22%20y%3D%2218%22%3Er%3C%2Ftext%3E%3Ctext%20font-family%3D%22Times%20New%20Roman%22%20font-size%3D%2220%22%20font-weight%3D%22bold%22%20text-anchor%3D%22middle%22%20x%3D%2261.5%22%20y%3D%2218%22%3Ei%3C%2Ftext%3E%3Ctext%20font-family%3D%22Times%20New%20Roman%22%20font-size%3D%2220%22%20font-weight%3D%22bold%22%20text-anchor%3D%22middle%22%20x%3D%2273.5%22%20y%3D%2218%22%3Em%3C%2Ftext%3E%3Ctext%20font-family%3D%22Times%20New%20Roman%22%20font-size%3D%2220%22%20font-weight%3D%22bold%22%20text-anchor%3D%22middle%22%20x%3D%2287.5%22%20y%3D%2218%22%3Ea%3C%2Ftext%3E%3Ctext%20font-family%3D%22Times%20New%20Roman%22%20font-size%3D%2220%22%20font-weight%3D%22bold%22%20text-anchor%3D%22middle%22%20x%3D%2296.5%22%20y%3D%2218%22%3Er%3C%2Ftext%3E%3Ctext%20font-family%3D%22Times%20New%20Roman%22%20font-size%3D%2220%22%20font-weight%3D%22bold%22%20text-anchor%3D%22middle%22%20x%3D%22105.5%22%20y%3D%2218%22%3Ey%3C%2Ftext%3E%3Ctext%20font-family%3D%22Times%20New%20Roman%22%20font-size%3D%2220%22%20font-weight%3D%22bold%22%20text-anchor%3D%22middle%22%20x%3D%22122.5%22%20y%3D%2218%22%3Ep%3C%2Ftext%3E%3Ctext%20font-family%3D%22Times%20New%20Roman%22%20font-size%3D%2220%22%20font-weight%3D%22bold%22%20text-anchor%3D%22middle%22%20x%3D%22132.5%22%20y%3D%2218%22%3Er%3C%2Ftext%3E%3Ctext%20font-family%3D%22Times%20New%20Roman%22%20font-size%3D%2220%22%20font-weight%3D%22bold%22%20text-anchor%3D%22middle%22%20x%3D%22141.5%22%20y%3D%2218%22%3Eo%3C%2Ftext%3E%3Ctext%20font-family%3D%22Times%20New%20Roman%22%20font-size%3D%2220%22%20font-weight%3D%22bold%22%20text-anchor%3D%22middle%22%20x%3D%22152.5%22%20y%3D%2218%22%3Ed%3C%2Ftext%3E%3Ctext%20font-family%3D%22Times%20New%20Roman%22%20font-size%3D%2220%22%20font-weight%3D%22bold%22%20text-anchor%3D%22middle%22%20x%3D%22163.5%22%20y%3D%2218%22%3Eu%3C%2Ftext%3E%3Ctext%20font-family%3D%22Times%20New%20Roman%22%20font-size%3D%2220%22%20font-weight%3D%22bold%22%20text-anchor%3D%22middle%22%20x%3D%22174.5%22%20y%3D%2218%22%3Ec%3C%2Ftext%3E%3Ctext%20font-family%3D%22Times%20New%20Roman%22%20font-size%3D%2220%22%20font-weight%3D%22bold%22%20text-anchor%3D%22middle%22%20x%3D%22182.5%22%20y%3D%2218%22%3Et%3C%2Ftext%3E%3Ctext%20font-family%3D%22Times%20New%20Roman%22%20font-size%3D%2220%22%20font-weight%3D%22bold%22%20text-anchor%3D%22middle%22%20x%3D%22189.5%22%20y%3D%2218%22%3Ei%3C%2Ftext%3E%3Ctext%20font-family%3D%22Times%20New%20Roman%22%20font-size%3D%2220%22%20font-weight%3D%22bold%22%20text-anchor%3D%22middle%22%20x%3D%22198.5%22%20y%3D%2218%22%3Eo%3C%2Ftext%3E%3Ctext%20font-family%3D%22Times%20New%20Roman%22%20font-size%3D%2220%22%20font-weight%3D%22bold%22%20text-anchor%3D%22middle%22%20x%3D%22209.5%22%20y%3D%2218%22%3En%3C%2Ftext%3E%3Ctext%20font-family%3D%22math143f4d31b04031e49f5eb18baba%22%20font-size%3D%2217%22%20font-weight%3D%22bold%22%20text-anchor%3D%22middle%22%20x%3D%22230.5%22%20y%3D%2218%22%3E%3D%3C%2Ftext%3E%3Ctext%20font-family%3D%22Times%20New%20Roman%22%20font-size%3D%2220%22%20font-weight%3D%22bold%22%20text-anchor%3D%22middle%22%20x%3D%22251.5%22%20y%3D%2218%22%3Eg%3C%2Ftext%3E%3Ctext%20font-family%3D%22Times%20New%20Roman%22%20font-size%3D%2220%22%20font-weight%3D%22bold%22%20text-anchor%3D%22middle%22%20x%3D%22261.5%22%20y%3D%2218%22%3Er%3C%2Ftext%3E%3Ctext%20font-family%3D%22Times%20New%20Roman%22%20font-size%3D%2220%22%20font-weight%3D%22bold%22%20text-anchor%3D%22middle%22%20x%3D%22270.5%22%20y%3D%2218%22%3Eo%3C%2Ftext%3E%3Ctext%20font-family%3D%22Times%20New%20Roman%22%20font-size%3D%2220%22%20font-weight%3D%22bold%22%20text-anchor%3D%22middle%22%20x%3D%22280.5%22%20y%3D%2218%22%3Es%3C%2Ftext%3E%3Ctext%20font-family%3D%22Times%20New%20Roman%22%20font-size%3D%2220%22%20font-weight%3D%22bold%22%20text-anchor%3D%22middle%22%20x%3D%22289.5%22%20y%3D%2218%22%3Es%3C%2Ftext%3E%3Ctext%20font-family%3D%22Times%20New%20Roman%22%20font-size%3D%2220%22%20font-weight%3D%22bold%22%20text-anchor%3D%22middle%22%20x%3D%22305.5%22%20y%3D%2218%22%3Ep%3C%2Ftext%3E%3Ctext%20font-family%3D%22Times%20New%20Roman%22%20font-size%3D%2220%22%20font-weight%3D%22bold%22%20text-anchor%3D%22middle%22%20x%3D%22315.5%22%20y%3D%2218%22%3Er%3C%2Ftext%3E%3Ctext%20font-family%3D%22Times%20New%20Roman%22%20font-size%3D%2220%22%20font-weight%3D%22bold%22%20text-anchor%3D%22middle%22%20x%3D%22322.5%22%20y%3D%2218%22%3Ei%3C%2Ftext%3E%3Ctext%20font-family%3D%22Times%20New%20Roman%22%20font-size%3D%2220%22%20font-weight%3D%22bold%22%20text-anchor%3D%22middle%22%20x%3D%22334.5%22%20y%3D%2218%22%3Em%3C%2Ftext%3E%3Ctext%20font-family%3D%22Times%20New%20Roman%22%20font-size%3D%2220%22%20font-weight%3D%22bold%22%20text-anchor%3D%22middle%22%20x%3D%22348.5%22%20y%3D%2218%22%3Ea%3C%2Ftext%3E%3Ctext%20font-family%3D%22Times%20New%20Roman%22%20font-size%3D%2220%22%20font-weight%3D%22bold%22%20text-anchor%3D%22middle%22%20x%3D%22357.5%22%20y%3D%2218%22%3Er%3C%2Ftext%3E%3Ctext%20font-family%3D%22Times%20New%20Roman%22%20font-size%3D%2220%22%20font-weight%3D%22bold%22%20text-anchor%3D%22middle%22%20x%3D%22366.5%22%20y%3D%2218%22%3Ey%3C%2Ftext%3E%3Ctext%20font-family%3D%22Times%20New%20Roman%22%20font-size%3D%2220%22%20font-weight%3D%22bold%22%20text-anchor%3D%22middle%22%20x%3D%22383.5%22%20y%3D%2218%22%3Ep%3C%2Ftext%3E%3Ctext%20font-family%3D%22Times%20New%20Roman%22%20font-size%3D%2220%22%20font-weight%3D%22bold%22%20text-anchor%3D%22middle%22%20x%3D%22393.5%22%20y%3D%2218%22%3Er%3C%2Ftext%3E%3Ctext%20font-family%3D%22Times%20New%20Roman%22%20font-size%3D%2220%22%20font-weight%3D%22bold%22%20text-anchor%3D%22middle%22%20x%3D%22402.5%22%20y%3D%2218%22%3Eo%3C%2Ftext%3E%3Ctext%20font-family%3D%22Times%20New%20Roman%22%20font-size%3D%2220%22%20font-weight%3D%22bold%22%20text-anchor%3D%22middle%22%20x%3D%22413.5%22%20y%3D%2218%22%3Ed%3C%2Ftext%3E%3Ctext%20font-family%3D%22Times%20New%20Roman%22%20font-size%3D%2220%22%20font-weight%3D%22bold%22%20text-anchor%3D%22middle%22%20x%3D%22424.5%22%20y%3D%2218%22%3Eu%3C%2Ftext%3E%3Ctext%20font-family%3D%22Times%20New%20Roman%22%20font-size%3D%2220%22%20font-weight%3D%22bold%22%20text-anchor%3D%22middle%22%20x%3D%22435.5%22%20y%3D%2218%22%3Ec%3C%2Ftext%3E%3Ctext%20font-family%3D%22Times%20New%20Roman%22%20font-size%3D%2220%22%20font-weight%3D%22bold%22%20text-anchor%3D%22middle%22%20x%3D%22443.5%22%20y%3D%2218%22%3Et%3C%2Ftext%3E%3Ctext%20font-family%3D%22Times%20New%20Roman%22%20font-size%3D%2220%22%20font-weight%3D%22bold%22%20text-anchor%3D%22middle%22%20x%3D%22450.5%22%20y%3D%2218%22%3Ei%3C%2Ftext%3E%3Ctext%20font-family%3D%22Times%20New%20Roman%22%20font-size%3D%2220%22%20font-weight%3D%22bold%22%20text-anchor%3D%22middle%22%20x%3D%22459.5%22%20y%3D%2218%22%3Eo%3C%2Ftext%3E%3Ctext%20font-family%3D%22Times%20New%20Roman%22%20font-size%3D%2220%22%20font-weight%3D%22bold%22%20text-anchor%3D%22middle%22%20x%3D%22470.5%22%20y%3D%2218%22%3En%3C%2Ftext%3E%3Ctext%20font-family%3D%22math143f4d31b04031e49f5eb18baba%22%20font-size%3D%2217%22%20font-weight%3D%22bold%22%20text-anchor%3D%22middle%22%20x%3D%22491.5%22%20y%3D%2218%22%3E%26%23x2212%3B%3C%2Ftext%3E%3Ctext%20font-family%3D%22Times%20New%20Roman%22%20font-size%3D%2220%22%20font-weight%3D%22bold%22%20text-anchor%3D%22middle%22%20x%3D%22511.5%22%20y%3D%2218%22%3Er%3C%2Ftext%3E%3Ctext%20font-family%3D%22Times%20New%20Roman%22%20font-size%3D%2220%22%20font-weight%3D%22bold%22%20text-anchor%3D%22middle%22%20x%3D%22520.5%22%20y%3D%2218%22%3Ee%3C%2Ftext%3E%3Ctext%20font-family%3D%22Times%20New%20Roman%22%20font-size%3D%2220%22%20font-weight%3D%22bold%22%20text-anchor%3D%22middle%22%20x%3D%22529.5%22%20y%3D%2218%22%3Es%3C%2Ftext%3E%3Ctext%20font-family%3D%22Times%20New%20Roman%22%20font-size%3D%2220%22%20font-weight%3D%22bold%22%20text-anchor%3D%22middle%22%20x%3D%22539.5%22%20y%3D%2218%22%3Ep%3C%2Ftext%3E%3Ctext%20font-family%3D%22Times%20New%20Roman%22%20font-size%3D%2220%22%20font-weight%3D%22bold%22%20text-anchor%3D%22middle%22%20x%3D%22548.5%22%20y%3D%2218%22%3Ei%3C%2Ftext%3E%3Ctext%20font-family%3D%22Times%20New%20Roman%22%20font-size%3D%2220%22%20font-weight%3D%22bold%22%20text-anchor%3D%22middle%22%20x%3D%22556.5%22%20y%3D%2218%22%3Er%3C%2Ftext%3E%3Ctext%20font-family%3D%22Times%20New%20Roman%22%20font-size%3D%2220%22%20font-weight%3D%22bold%22%20text-anchor%3D%22middle%22%20x%3D%22565.5%22%20y%3D%2218%22%3Ea%3C%2Ftext%3E%3Ctext%20font-family%3D%22Times%20New%20Roman%22%20font-size%3D%2220%22%20font-weight%3D%22bold%22%20text-anchor%3D%22middle%22%20x%3D%22573.5%22%20y%3D%2218%22%3Et%3C%2Ftext%3E%3Ctext%20font-family%3D%22Times%20New%20Roman%22%20font-size%3D%2220%22%20font-weight%3D%22bold%22%20text-anchor%3D%22middle%22%20x%3D%22582.5%22%20y%3D%2218%22%3Eo%3C%2Ftext%3E%3Ctext%20font-family%3D%22Times%20New%20Roman%22%20font-size%3D%2220%22%20font-weight%3D%22bold%22%20text-anchor%3D%22middle%22%20x%3D%22592.5%22%20y%3D%2218%22%3Er%3C%2Ftext%3E%3Ctext%20font-family%3D%22Times%20New%20Roman%22%20font-size%3D%2220%22%20font-weight%3D%22bold%22%20text-anchor%3D%22middle%22%20x%3D%22601.5%22%20y%3D%2218%22%3Ey%3C%2Ftext%3E%3Ctext%20font-family%3D%22Times%20New%20Roman%22%20font-size%3D%2220%22%20font-weight%3D%22bold%22%20text-anchor%3D%22middle%22%20x%3D%22616.5%22%20y%3D%2218%22%3El%3C%2Ftext%3E%3Ctext%20font-family%3D%22Times%20New%20Roman%22%20font-size%3D%2220%22%20font-weight%3D%22bold%22%20text-anchor%3D%22middle%22%20x%3D%22625.5%22%20y%3D%2218%22%3Eo%3C%2Ftext%3E%3Ctext%20font-family%3D%22Times%20New%20Roman%22%20font-size%3D%2220%22%20font-weight%3D%22bold%22%20text-anchor%3D%22middle%22%20x%3D%22635.5%22%20y%3D%2218%22%3Es%3C%2Ftext%3E%3Ctext%20font-family%3D%22Times%20New%20Roman%22%20font-size%3D%2220%22%20font-weight%3D%22bold%22%20text-anchor%3D%22middle%22%20x%3D%22644.5%22%20y%3D%2218%22%3Es%3C%2Ftext%3E%3Ctext%20font-family%3D%22Times%20New%20Roman%22%20font-size%3D%2220%22%20font-weight%3D%22bold%22%20text-anchor%3D%22middle%22%20x%3D%2259.5%22%20y%3D%2245%22%3EN%3C%2Ftext%3E%3Ctext%20font-family%3D%22Times%20New%20Roman%22%20font-size%3D%2220%22%20font-weight%3D%22bold%22%20text-anchor%3D%22middle%22%20x%3D%2273.5%22%20y%3D%2245%22%3EP%3C%2Ftext%3E%3Ctext%20font-family%3D%22Times%20New%20Roman%22%20font-size%3D%2220%22%20font-weight%3D%22bold%22%20text-anchor%3D%22middle%22%20x%3D%2285.5%22%20y%3D%2245%22%3EP%3C%2Ftext%3E%3Ctext%20font-family%3D%22math143f4d31b04031e49f5eb18baba%22%20font-size%3D%2217%22%20font-weight%3D%22bold%22%20text-anchor%3D%22middle%22%20x%3D%22226.5%22%20y%3D%2245%22%3E%3D%3C%2Ftext%3E%3Ctext%20font-family%3D%22Times%20New%20Roman%22%20font-size%3D%2220%22%20font-weight%3D%22bold%22%20text-anchor%3D%22middle%22%20x%3D%22382.5%22%20y%3D%2245%22%3EG%3C%2Ftext%3E%3Ctext%20font-family%3D%22Times%20New%20Roman%22%20font-size%3D%2220%22%20font-weight%3D%22bold%22%20text-anchor%3D%22middle%22%20x%3D%22396.5%22%20y%3D%2245%22%3EP%3C%2Ftext%3E%3Ctext%20font-family%3D%22Times%20New%20Roman%22%20font-size%3D%2220%22%20font-weight%3D%22bold%22%20text-anchor%3D%22middle%22%20x%3D%22408.5%22%20y%3D%2245%22%3EP%3C%2Ftext%3E%3Ctext%20font-family%3D%22math143f4d31b04031e49f5eb18baba%22%20font-size%3D%2217%22%20font-weight%3D%22bold%22%20text-anchor%3D%22middle%22%20x%3D%22513.5%22%20y%3D%2245%22%3E%26%23x2212%3B%3C%2Ftext%3E%3Ctext%20font-family%3D%22Times%20New%20Roman%22%20font-size%3D%2220%22%20font-weight%3D%22bold%22%20text-anchor%3D%22middle%22%20x%3D%22596.5%22%20y%3D%2245%22%3ER%3C%2Ftext%3E%3C%2Fsvg%3E)


