
The Fieldwork Report
River Enquiry Data Presentation
- Data presentation can take many forms
Primary Data
- Much of the primary data collected in a river enquiry will be presented in the form of a graphs
- Each type of graph is suitable for particular data sets
- The graphs also may have strengths and limitations
- Suitable graphs include:
- Line graphs for river channel cross-sections
- Bar graphs to compare different sites
- Scattergraphs to show the relationship between two sets of data. For example, the river width and discharge
Worked example
Using the data in Figure 4a, complete Figure 4b below for measurements 1 and 4 (2)
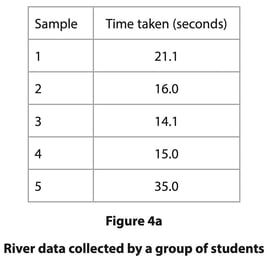

Figure 4b
Measurements times taken for float to travel between points A and B at one site
- Answer
- The first bar needs to be between 21 and 22 (each small square is 1 second). The second bar must be on the line. The bars do not need to be shaded but should be the same width as the other bars.

Figure 4b
Measurements times taken for float to travel between points A and B at one site
Mark an x in the box on Figure 4b which represents the float with the anomalous result (1)
- Answer
- Number 5 (1) is the anomalous one as it does not fit the pattern of the other measurements
Suggest one explanation for this anomaly (2)
- Answer
-
- The float could have got stuck as it flowed down the river (1) this would have slowed the float down (1)
- There could have been a strong wind blowing upstream (1) which would have slowed down the float / which would have led to unreliable results (1)
- Human error with the operation of the stopwatch (1) which meant that the timing was inaccurately recorded for number 5 (1)
Exam Tip
In the exam, you will not be asked to draw an entire graph. However, it is common to be asked to complete an unfinished graph using the data provided. You may also be asked to identify anomalous results or to draw the best fit line on a scattergraph.
- Take your time to ensure that you have marked the data on the graph accurately
- Use the same style as the data which has already been put on the graph
- Bars on a bar graph should be the same width
- If the dots on a graph are connected by a line you should do the same
Secondary Data
- Any fieldwork should include secondary data as well as primary data
- In a river enquiry suitable secondary data may include:
- River discharge data from the Environment Agency
- Weather data from the Meteorological Office (Met Office)
- Old photographs of the river sample site
- Newspaper articles/websites about the river
- Ordnance Survey maps to identify the sample sites
- Geology maps
- Aerial photographs
Worked example
Describe two sources of secondary data that might be useful when planning a river channel enquiry (4)
- Answer:
- Environment Agency or National Rivers Authority (NRA) discharge data (1) gives information about normal flow (1)
- Met Office rainfall data (1) gives information regarding any weather events impacting on data collected (1)
- Ordnance Survey (OS) map (1) enables the identification of sample site locations (1)
- Geology map (1) rock type information for the drainage basin (1)
- Aerial photographs (1) changes in the river channel path (1)

