
Using Quantitative data to make Business Decisions
- Quantitative data is statistical numeric data that can be used to support decision making
- Quantitative data needs to be accurate and interpreted correctly if it is to be useful
- Quantitative data needs to be accurate and interpreted correctly if it is to be useful
- Quantitative data may be collected from primary or secondary sources
- Primary data is collected first hand for a specific purpose
- Secondary data has been collected by someone else
- Sources of quantitative data include
- graphs and charts
- financial data
- marketing data
- tables or infographics
1. Information from Graphs & Charts
- Information presented in graphs and charts is often easy to understand because it is presented visually
Types of Graphs & Charts
Name |
Explanation |
Example |
|
Bar Chart |
|
|
|
Pie Chart |
|
|
|
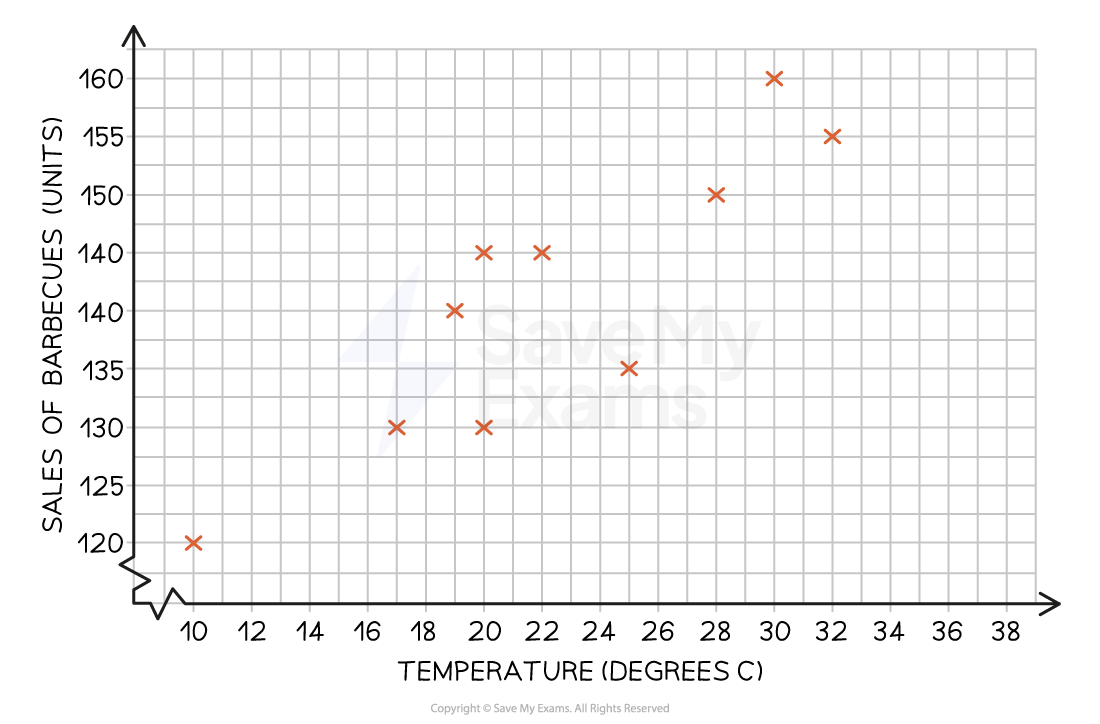
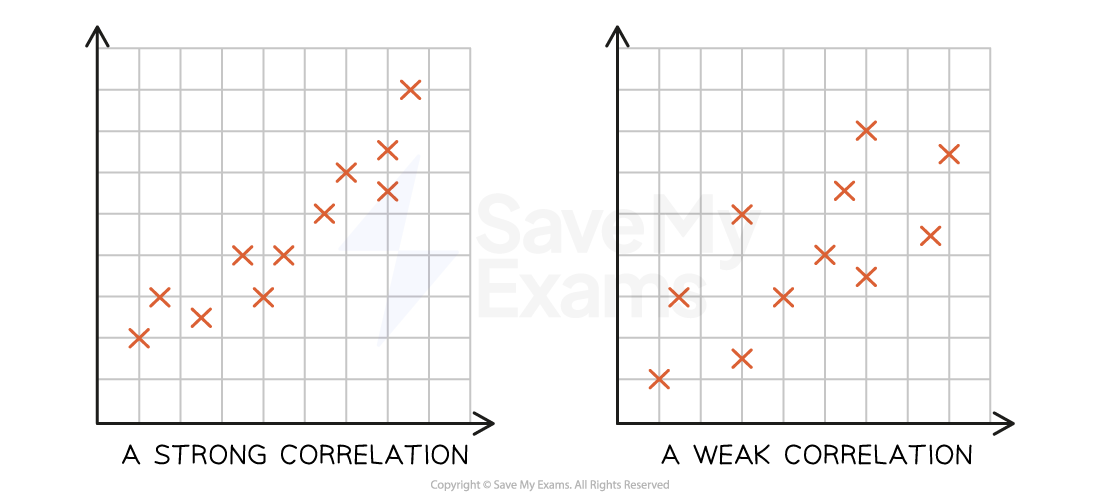
Scatter Graph |
|
|


2. Financial Data
- Businesses can use a selection of internal and external financial data to support decision making including
- Sales revenue
- Profit
- Costs
- Tax
- Interest and exchange rates
- Valuations of assets
- Bank balances
- Companies need to send key financial data to Companies House each year whereas sole traders and partnerships may keep this information private
Marketing Data
- Marketing data is collected through primary and secondary market research such as
- Surveys
- Focus groups
- Observation
- Customer feedback
- Retail or online footfall
- Government or trade publications
- The media
- Marketing data can help business managers forecast sales and to make decisions about product development and promotional plans
Market Data
- Market data refers to the characteristics and performance of the market in which a business operates such as
- Demographic data relates to the market's population structure such as age, gender and income statistics
- Market dimensions includes factors such as the size of the market, the market shares of key competitors, the rate of market growth and average prices across the market
- Investment data relates to the prices of commodities (e.g. oil) as well as exchange rate data and stock market performance
- Market data can help a business identify and plan for new opportunities and spot external threats such as the increased power of a competitor
- It can also be used alongside other types of quantitative data to make investment decisions
Exam Tip
You are often required to interpret quantitative data in exam questions so ensure that you practise these skills and understand how data can be used to inform decision making and provide justification for decisions.
Make sure that you also consider relevant qualitative factors, though - especially where a decision is not clear-cut.
Some powerful qualitative factors can include the wishes of the business leader, the impact on stakeholders and whether the business has aims that are not purely financial.
