AQA GCSE Biology

Topic Questions

7.4 Trophic Levels in an Ecosystem

1a1 mark

Which of the following statements A - D best defines a secondary consumer in a food chain?

  • A carnivore that eats a herbivore

  • A herbivore that eats a producer

  • A carnivore that also eats plants (an omnivore)

  • An apex predator

1b1 mark

State the process by which decomposers absorb nutrients into their cells.

1c1 mark

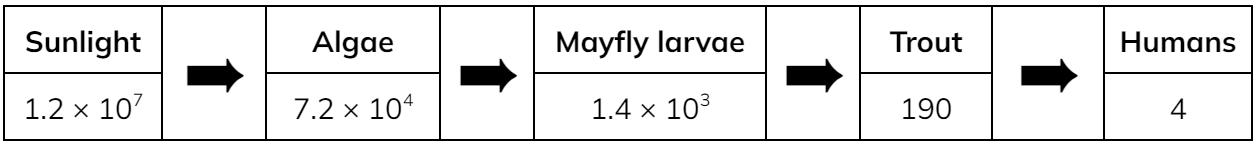
Figure 1  shows a short food chain.

Figure 1

food-chain-1

Tick (✔) one box to show the trophic level occupied by the coyote. 

1  
2  
3  


1d2 marks

The beaver's diet consists of tree bark, rushes and other plant matter found in its habitat. 

Beavers do not eat other animals. 

Explain why the beaver is defined as a herbivore. 

Did this page help you?

2a1 mark

Which of the following is the accepted way of demonstrating biomass in different trophic levels in an ecosystem?

aaSFGESl_woodworm-damage-1

2b3 marks

Select the correct word from each set of brackets to complete the passage accurately. 

A pyramid of biomass shows layers that correspond to individual {tropic / feeding / trophic} levels. The highest level shows the biomass of {one of / all of / some of} the {final / apex / terminal} predators in a food {chain / web / ecosystem}.

2c2 marks

Figure 2 below shows three attempts made by a student to construct a pyramid of biomass. There are errors in all three attempts.

Figure 2

pyramids-wrong-1

Identify the errors.

2d1 mark

In a pyramid of biomass, what quantity does the width of each layer represent?

Did this page help you?

3a
Sme Calculator
3 marks

A food chain is shown in Figure 3 below, along with the levels of biomass at each trophic level.

Figure 3

biomass-in-food-chain-q-1

Complete the pyramid of biomass below; the sparrowhawk and blue tit have been completed for you. 

biomass-q-1

3b
Sme Calculator
2 marks

For the food chain shown in Figure 3, calculate the percentage of the oak tree's biomass that is present in the blue tits. 

3c1 mark

The units of biomass are given in Figure 3 as kg/m2. What does the m2 part of this unit refer to?

3d1 mark

Give one reason why in a pyramid of biomass, each level is narrower than the level below it.

Did this page help you?

4a3 marks

Figure 4 shows members of a food chain from a marine ecosystem. The boxes on the right represent how each species would appear in a pyramid of biomass. 

Figure 4

marine-food-chain-qv-1

Use the information in Figure 4 and your own knowledge to join, with a straight line, each species shown with the appropriately-sized box on the right. 

4b1 mark

Which statement A - D best explains why pyramids of biomass rarely contain more levels than the five levels shown in Figure 4 (question 4a)?

  • Because five levels allows greater biodiversity than say, 8 or 10 levels.

  • Because an apex predator isn't eaten by anything else. 

  • There is a large loss of biomass at each trophic level so the food chain can only sustain a few apex predators.

  • Because consumers in a food chain are usually connected to other food chains in a food web. 

4c
Sme Calculator
2 marks

In a food chain, 8% of the biomass of the producer is passed to the primary consumer. Of that, only 7% is passed onto the secondary consumer. The producer's biomass is 10 000 kg in this food chain. 

Calculate the amount of biomass that is gained by the secondary consumer in this food chain. 

4d2 marks

State two ways in which biomass is lost between one trophic level and the next. 

Did this page help you?

5a2 marks

Figure 5 shows a food web from a marine ecosystem.

Figure 5

food-web---sea-2

Identify two secondary consumers in this food web. 

5b2 marks

Identify the apex predators in Figure 5 from Question 1a).

5c2 marks

For the food web in Figure 5 of Question 1a), suggest and explain one effect on crabs if humans were to increase the amount of lobsters caught in this part of the sea.

5d2 marks

The role of a producer in a food chain is to produce food.

What process is used and what food type is produced by the majority of producers?

Process ____________________

Food Type __________________

Did this page help you?

1a
Sme Calculator
2 marks

A group of researchers investigated a food chain on a piece of waste ground. 

Clover   →   slug   →   starling (a bird)

The researchers made various counts / estimates, as follows:

  • An estimate of the number of clover plants growing on the waste ground
  • An estimate of the number of slugs feeding on the clover
  • A count of the number of starling appearances on the waste ground over a 6-hour period

Table 1 shows the results of the investigation and some of the researchers' calculations. 

Table 1

Organism Population size Mean mass of each organism in g Biomass of population in g Biomass lost from previous organism in g Percentage of biomass lost
Clover 10 900 1.5 16 350    
Slug 215 4.1 882 X Y
Starling 4 85 340 542 61


Calculate the missing values X and Y in Table 1.

1b1 mark

The general rule adopted by ecologists is that around 90% of biomass is lost from one trophic level to the next. 

Suggest one reason why the data in Table 1 gave a 'percentage of biomass lost' value of only 61% between the slugs and the starlings.

1c
Sme Calculator
4 marks

In a similar study on another piece of ground, the researchers estimated the number of clover plants in the area of waste ground to be 17 600 plants.

The area of the waste ground was measured accurately using GPS technology and found to be 2 200 m2.

The quadrats used by the researchers were 0.5m × 0.5m square.

Given that the researchers actually counted a total of 880 clover plants, calculate the number of quadrats that they sampled in this area of waste ground. 

1d2 marks

Give two suggestions why calculations of the type in Table 1 are often subject to error. 

Did this page help you?

2a3 marks

A petfood company is developing a new brand of cat food that does not contain meat from fish, chicken or traditional 'livestock' animals like sheep, pigs and cows.

Instead, the cat food is made from insects. These insects are bred in the cat food factory and fed on waste vegetable matter. 

Sketch a pyramid of biomass for the food chain that produces cat food in this manner. 

2b2 marks

Use your knowledge of trophic levels and pyramids of biomass to suggest two reasons why a company would wish to make pet food from insects. 

2c2 marks

Other sources of food for the insects described in Question 2a) include:

  • Spent grains eg. from beer brewing process
  • By-products from the manufacture of food for human consumption eg.
    • Palm kernels from palm oil production
    • Offal and animal products

State two environmental benefits of using these food sources for farming insects for pet food manufacture. 

2d3 marks

A pyramid of biomass for a natural food chain would differ in appearance from a pyramid of biomass for a man-made process such as pet food manufacture. The two pyramids might look like those sketched A and B in Figure 1 below. 

Figure 1

2-pyramids-a-and-b-1

Deduce whether sketch A or B is the pyramid for a natural food chain.

Explain your choice. 

Did this page help you?

3a
Sme Calculator
3 marks

Figure 2 shows a food chain for organisms in an area of grassland. Also included is the biomass of the organisms at each trophic level.

Figure 2

food-chain-hard-q-1

Draw a pyramid of biomass for the food chain in Figure 2 on Figure 3.

You should:

  • use a suitable scale
  • label the x-axis
  • label each trophic level

Figure 3

pyramid-hard-ma-1

3b2 marks

Biomass is a measure of the mass of a number of organisms, so a scientist might be tempted to measure biomass in the units of mass, kilograms (kg). However, the unit used in the food chain shown in Figure 2 is kg/m2.

Explain why. 

3c
Sme Calculator
2 marks

Some units of biomass are expressed with a consideration of time.

For example, one such unit is kg m-2 yr-1, which stands for kilograms per square metre per year

Suggest a reason why a time consideration is given to the measurement of biomass. 

3d
Sme Calculator
2 marks

Calculate the percentage efficiency of the food chain shown in Figure 2.

Give your answer to 2 significant figures. 

3e2 marks

Explain why a pyramid of biomass often only has a narrow line to depict the apex predator, rather than rectangular box.

Did this page help you?

4a3 marks

Figure 4 below shows a food chain from the Weddell Sea, an area of the Southern Ocean off the coast of Antarctica. 

Figure 4

_weddell-sea-food-chain-q-1

Human fishing activity has removed large amounts of sea bass, which is a popular food in many countries. 

There is some debate about the effect this would have on the numbers of Antarctic squid and icefish in the Weddell Sea. Some scientists believe that the numbers of squid and icefish will decrease, whilst others claim that squid and icefish numbers will not be affected. 

Explain both sides of this debate.

(i) Why numbers may decrease

[1 mark]

(ii) Why numbers might stay the same.

[2 marks]

4b
Sme Calculator
3 marks

Part of the Weddell Sea food chain from Figure 4 in Question 1a) is shown below in Figure 5, which includes data on the biomass of the organisms that form part of that food chain. 

Figure 5

food-chain-weddell-biomass-1

Draw and label a pyramid of biomass for this food chain. 

pyramid-hard-ma-1

4c
Sme Calculator
2 marks

Using the data from Figure 5, complete Table 2 below to show the percentage efficiency of each biomass transfer of the Weddell Sea.

Table 2

Biomass Transfer Efficiency (%)
Phytoplankton to krill  
Krill to sea bass  
Sea bass to Weddell seal  

4d3 marks

Explain, as fully as you can, why the conversion of shrimp biomass into sea bass biomass is more efficient than that of sea bass biomass into Weddell seal biomass in the cold Weddell Sea. 

Did this page help you?

5a
Sme Calculator
3 marks

The flow of biomass through part of a food chain is shown in Figure 6 below. The diagram is drawn to scale. 

Figure 6

microsoft-lens-2
Use the information in Figure 6 to calculate:

(i) The amount of biomass transferred to the primary consumers;

[1 mark]

(ii) The percentage of the biomass originally gained during photosynthesis that was finally transferred to secondary consumers. 

[2 marks]

5b4 marks

For the food chain such as the one shown in Figure 6 in Question 5a), describe the role of decomposers in the transfer of biomass.

Use your knowledge to give an example of decomposition and biomass transfer in a named ecosystem. 

Did this page help you?

1a2 marks

Figure 1 shows a food chain for different organisms living in the sea. This biomass at each trophic level is also shown.

Figure 1

food-chain-1a

Describe the third trophic level of this food chain.

1b4 marks

Draw a pyramid of biomass for the food chain shown in Figure 1 on the graph axis provided in Figure 2.

You should use a suitable scale and ensure that all labels are included.

Figure 2

graph-axis-1b

1c3 marks

Calculate the percentage of the biomass transferred from the phytoplankton to the snapper fish.

Give the answer to 2 significant figures.

1d3 marks

Give three ways in which biomass can be lost between trophic levels.

Did this page help you?

2a4 marks

Figure 1 shows a food chain in an ecosystem that has five different organisms occupying five trophic levels, A, B, C, D and E.

Figure 1

FYBRUJn8_1

Name the type of organism not shown in the food chain in Figure 1 and explain the role it plays in an ecosystem.

2b4 marks

Table 1 below shows the energy transferred to the next trophic level by each organism in one year.

Table 1

Organism Energy transferred in kJ per year
A 950 000
B 136 000
C 25 000
D 2 125

Explain why organism D transfers less energy to the next trophic level than organism A.

2c2 marks

Explain why food chains rarely have more than five trophic levels.

Did this page help you?

3a3 marks

Figure 1 shows the flow of energy through a food chain in a habitat over the course of one year. The figures are in kJ m–2.

Figure 1

trophic-levels

Calculate the percentage of the energy in sunlight that was transferred into energy in the mayfly larvae

Show your working.

Give your answer in standard form.

3b3 marks

The percentage of the sun’s energy that is transferred to photosynthetic plants is usually very low.

Suggest three reasons why.

3c3 marks

Compare the amount of energy transferred to the trout with the amount of energy transferred to humans.

Suggest explanations for the difference in the amount of energy transferred to the two different consumers.

Did this page help you?

4a2 marks

Two food chains are shown below:

Food chain 1: Soya bean plants → Salmon  → Human

Food chain 2: Soya bean plants → Human

Table 1 shows some data about the energy transferred between organisms in the food chains.

Table 1

Food Consumer Percentage of available energy transferred as useful energy
Soya bean plant Human 5%
Soya bean plant Salmon 15%
Salmon Human 10%

Using the information provided, compare the efficiency of these two food chains.

4b2 marks

Figure 1 below shows a pyramid of numbers and a pyramid of biomass for an area of woodland.

Figure 1

pyramid-of-biomass-and-numbers

Explain why the level labelled X is a different width in the two pyramids

4c6 marks

Figure 2 shows a food chain in a woodland area.

Figure 2

b3OzD2jl_3

Energy from the sun is captured by the plants in the wood.

Describe and explain the route of this energy through the food chain after it has been captured by the plants in the wood.

Did this page help you?

5a3 marks

Table 1 contains information about two farms. Both farms are of similar size and have similar conditions.

Table 1

farms

The data in Table 1 show that farms like Haverstock Farm can be more than 12 times as efficient at meeting the food energy requirements for our growing human population than farms which grow feed for livestock.

Explain why Haverstock Farm is much more efficient at meeting human food energy requirements

5b1 mark

Decomposers, including fungi, bacteria and arthropods are of fundamental importance in agriculture.

Explain why decomposers are so important to famers.

5c2 marks

Describe the mechanism by which fungi obtain nutrients from dead organic matter.

Did this page help you?