OCR A Level Physics

Revision Notes

3.1.3 Displacement & Velocity-Time Graphs

Test Yourself

Displacement-Time Graphs

  • Displacement-time graphs show the changing position of an object in motion
  • They also show whether an object is moving forwards (positive displacement) or backwards (negative displacement)

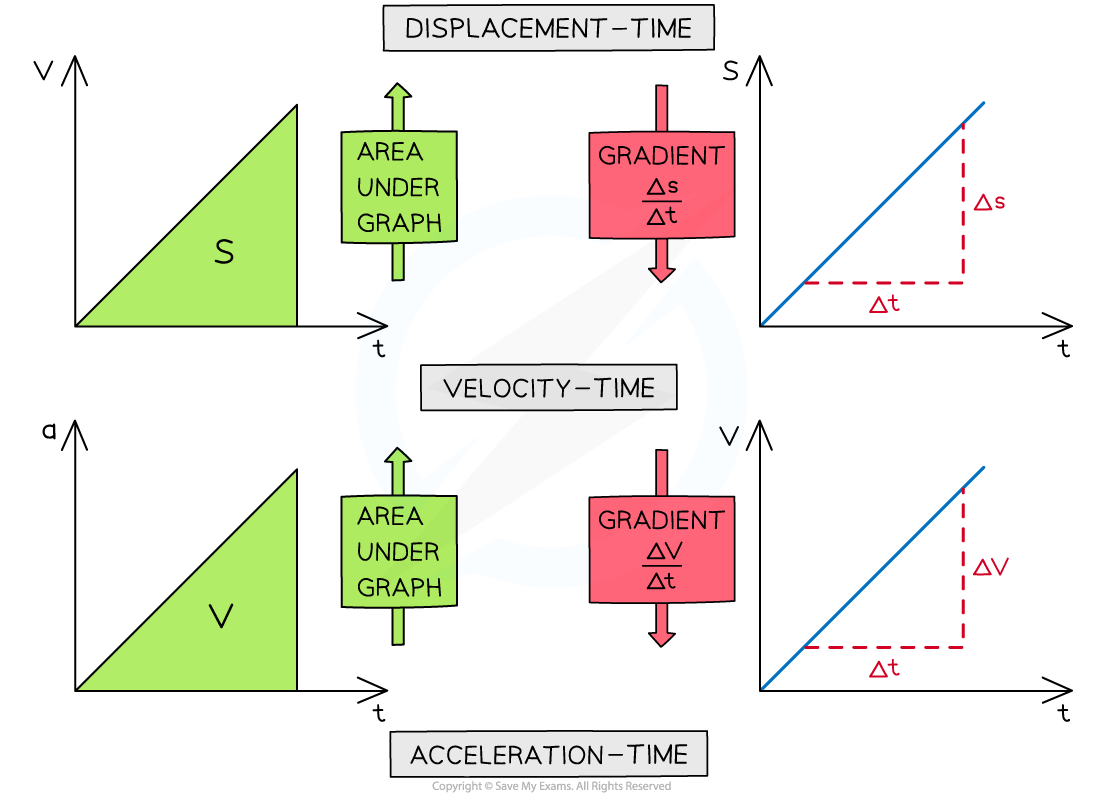
Velocity = Gradient of a displacement-time graph

  • The greater the slope, the greater the velocity
  • A negative gradient = a negative velocity (the object is moving backwards)

Worked example

A car driver sees a hazard ahead and applies the brakes to bring the car to rest.What does the displacement-time graph look like?WE - S-T gradient question image, downloadable AS & A Level Physics revision notes

WE - S-T gradient answer image, downloadable IB Chemistry revision notes

Velocity-Time Graphs

  • Velocity-time graphs show the speed and direction of an object in motion over a specific period of time
  • The area under a velocity-time graph is equal to the displacement of a moving object

Displacement = Area under a velocity-time graph

  • Acceleration is any change in the velocity of an object in a given time
  • As velocity is a vector quantity, this means that if the speed of an object changes, or its direction changes, then it is accelerating
    • An object that slows down tends to be described as ‘decelerating’

Acceleration = Gradient of a velocity-time graph

Motion of a Bouncing Ball

  • For a bouncing ball, the acceleration due to gravity is always in the same direction (in a uniform gravitational field such as the Earth's surface)
    • This is assuming there are no other forces on the ball, such as air resistance

  • Since the ball changes its direction when it reaches its highest and lowest point, the direction of the velocity will change at these points
  • The vector nature of velocity means the ball will sometimes have a:
    • Positive velocity if it is travelling in the positive direction
    • Negative velocity if it is travelling in the negative direction

  • An example could be a ball bouncing from the ground back upwards and back down again
    • The positive direction is taken as upwards
    • This will be either stated in the question or can be chosen, as long as the direction is consistent throughout

  • Ignoring the effect of air resistance, the ball will reach the same height every time before bouncing from the ground again
  • When the ball is travelling upwards, it has a positive velocity which slowly decreases (decelerates) until it reaches its highest point

Motion of Bouncing Ball 1, downloadable AS & A Level Physics revision notesMotion of Bouncing Ball 2, downloadable AS & A Level Physics revision notes

  • At point A (the highest point):
    • The ball is at its maximum displacement
    • The ball momentarily has zero velocity
    • The velocity changes from positive to negative as the ball changes direction
    • The acceleration, g, is still constant and directed vertically downwards

  • At point B (the lowest point):
    • The ball is at its minimum displacement (on the ground)
    • Its velocity changes instantaneously from negative to positive, but its speed (magnitude) remains the same
    • The change in direction causes a momentary acceleration (since acceleration = change in velocity / time)

Worked example

The velocity-time graph of a vehicle travelling with uniform acceleration is shown in the diagram below.v-t Area Worked Example (1), downloadable AS & A Level Physics revision notesCalculate the displacement of the vehicle at 40 s.

v-t Area Worked Example (2), downloadable AS & A Level Physics revision notes

Summary of Gradients & Areas

  • The gradient of a displacement-time graph is the velocity
  • The gradient of a velocity-time graph is the acceleration
  • The area under a velocity-time graph is the displacement
  • The area under an acceleration-time graph is the velocity

Motion Graphs, downloadable AS & A Level Physics revision notes

Exam Tip

Always check the values given on the y-axis of a motion graph - students often confuse displacement-time graphs and velocity-time graphs.The area under the graph can often be broken down into triangles, squares and rectangles, so make sure you are comfortable with calculating area!

You've read 0 of your 0 free revision notes

Get unlimited access

to absolutely everything:

  • Downloadable PDFs
  • Unlimited Revision Notes
  • Topic Questions
  • Past Papers
  • Model Answers
  • Videos (Maths and Science)

Join the 100,000+ Students that ❤️ Save My Exams

the (exam) results speak for themselves:

Did this page help you?

Katie M

Author: Katie M

Katie has always been passionate about the sciences, and completed a degree in Astrophysics at Sheffield University. She decided that she wanted to inspire other young people, so moved to Bristol to complete a PGCE in Secondary Science. She particularly loves creating fun and absorbing materials to help students achieve their exam potential.