Required Practical: Investigating Gas Laws
Investigating Boyle's Law
- The overall aim of this experiment is to investigate the effect of Boyle's Law
- This is the effect of pressure on volume at a constant temperature
- This is just one example of how this required practical might be tackled
Variables
- Independent variable = Mass, m (kg)
- Dependent variable = Volume, V (m3)
- Control variables:
- Temperature
- Cross-sectional area of the syringe
Equipment List
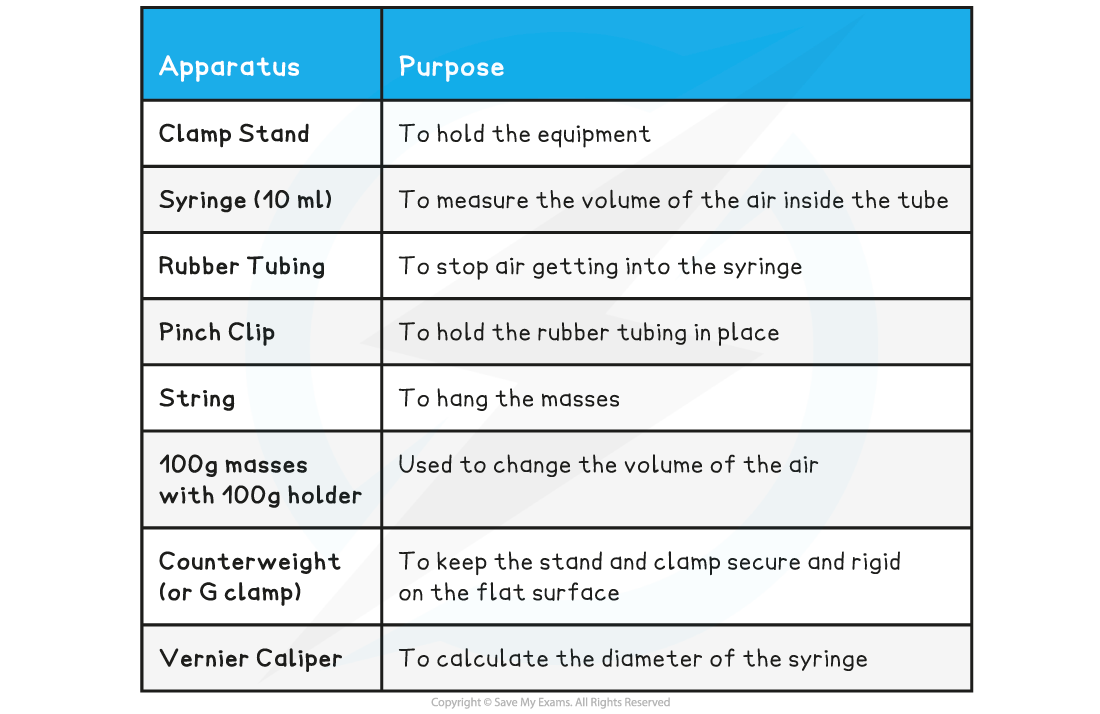
- Resolution of measuring equipment:
- Pressure gauge = 0.02 × 10⁵ Pa
- Volume = 0.2 cm3
- Vernier Caliper = 0.02 mm
Method
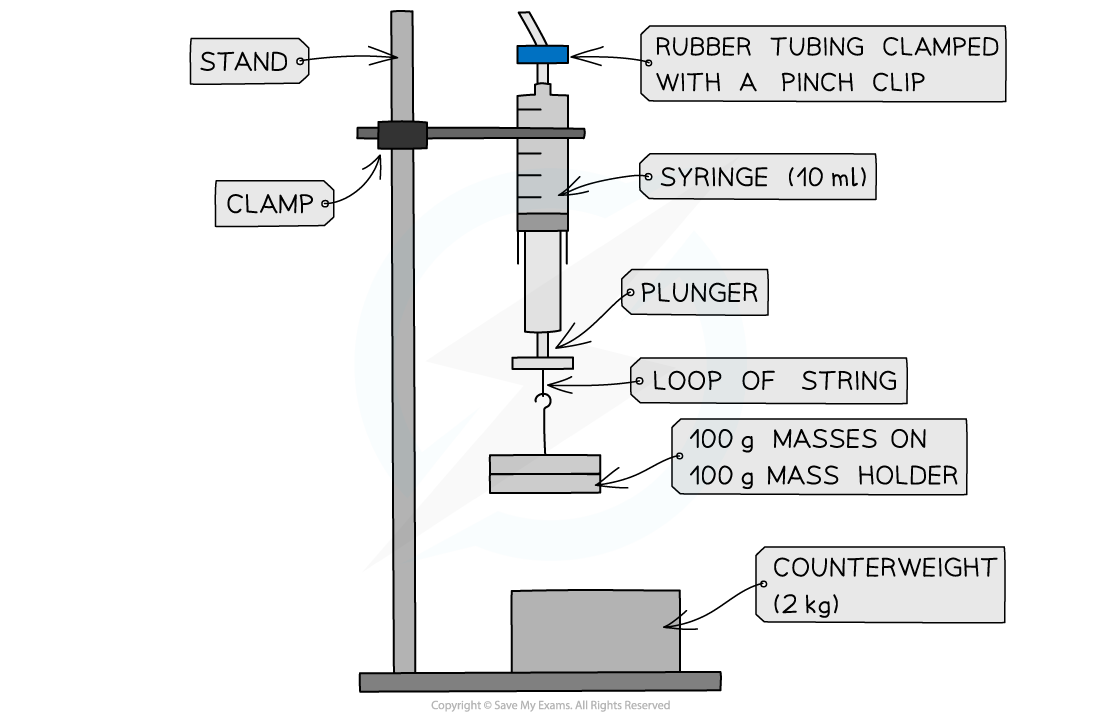
Apparatus setup for Boyle’s Law
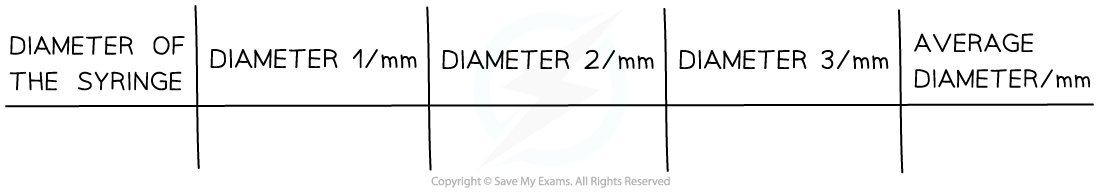
- With the plunger removed from the syringe, measure the inside diameter, d of the syringe using a vernier calliper. Remember to take at least 3 repeat readings and find an average
- The plunger should be replaced and the rubber tubing should be fit over the nozzle and clamped with a pinch clip as close to the nozzle as possible
- Set up the apparatus as shown in the diagram and make sure the temperature of the room will remain constant throughout
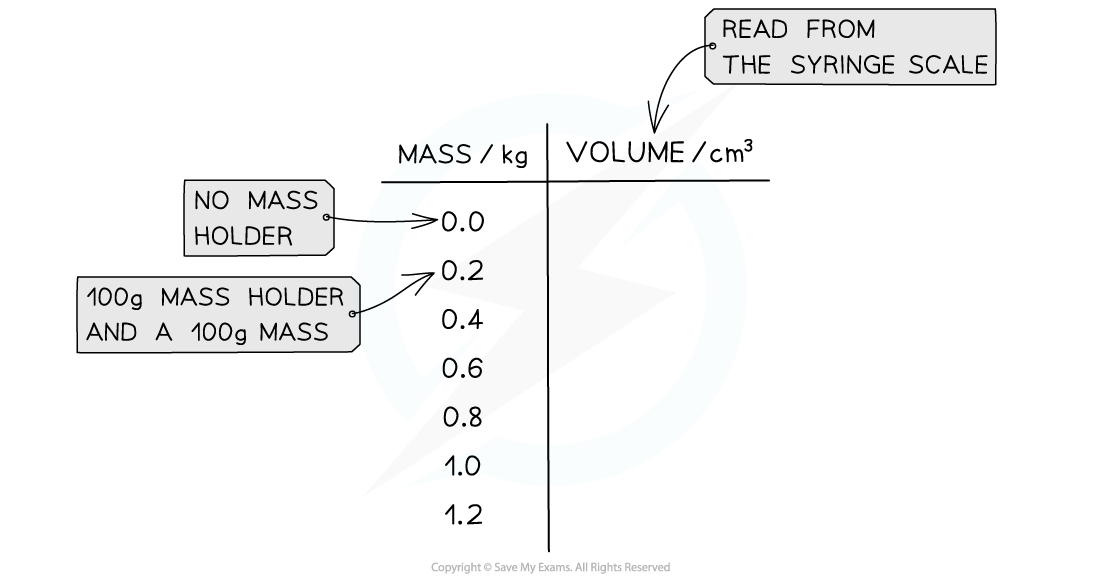
- Push the syringe upwards to remove the air until it reads the lowest volume of air visible. Record this volume
- Add the 100 g mass holder with a 100 g mass on it to the loop of string at the bottom of the plunger. Wait a few seconds to ensure the temperature is kept constant since work is done against the plunger when the volume increases
- Record the value of the new volume from the syringe scale
- Repeat the experiment by adding two 100 g masses at a time up to 8-10 readings. This is so a significant change in volume can be seen each time
- Record the mass and volume
- An example table of results might look like this:
Analysing the Results
- Boyle’s Law can be represented by the equation:
pV = constant
- This means the pressure must be calculated from the experiment
- The exerted pressure of the masses is calculated by:

- Where:
- F = weight of the masses, mg (N)
- A = cross-sectional area of the syringe (m2)
- The cross-sectional area is found from the equation for the area of a circle:

- To calculate the pressure of the gas:
Pressure of the gas = Atmospheric pressure – Exerted pressure from the masses
- Where:
- Atmospheric pressure = 101 kPa
- The table of results may need to be modified to fit these extra calculations. Here is an example of how this might look:
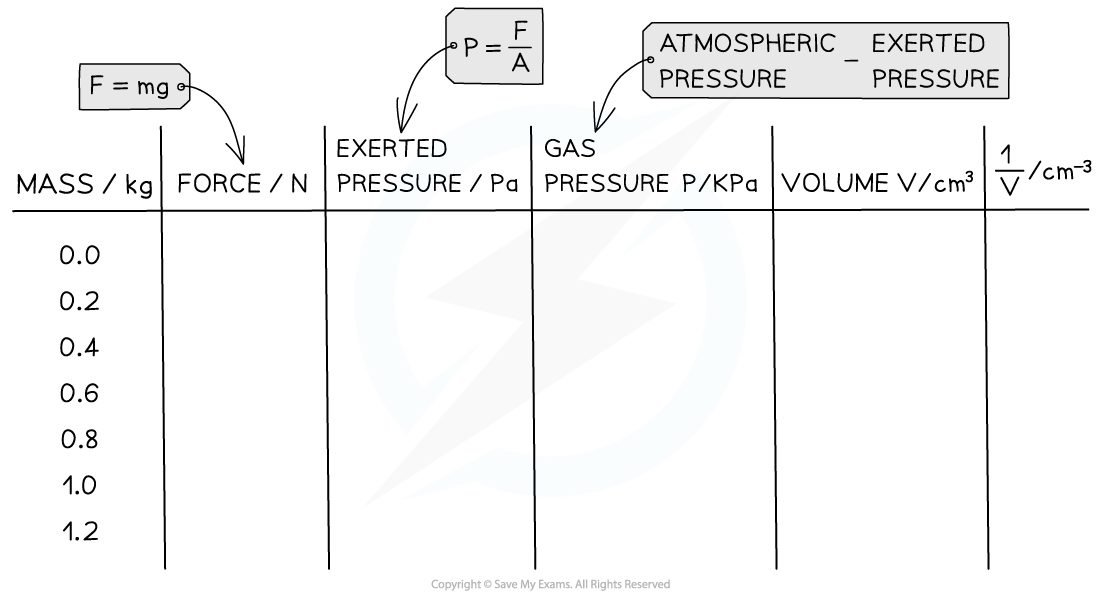
- Once these values are calculated:
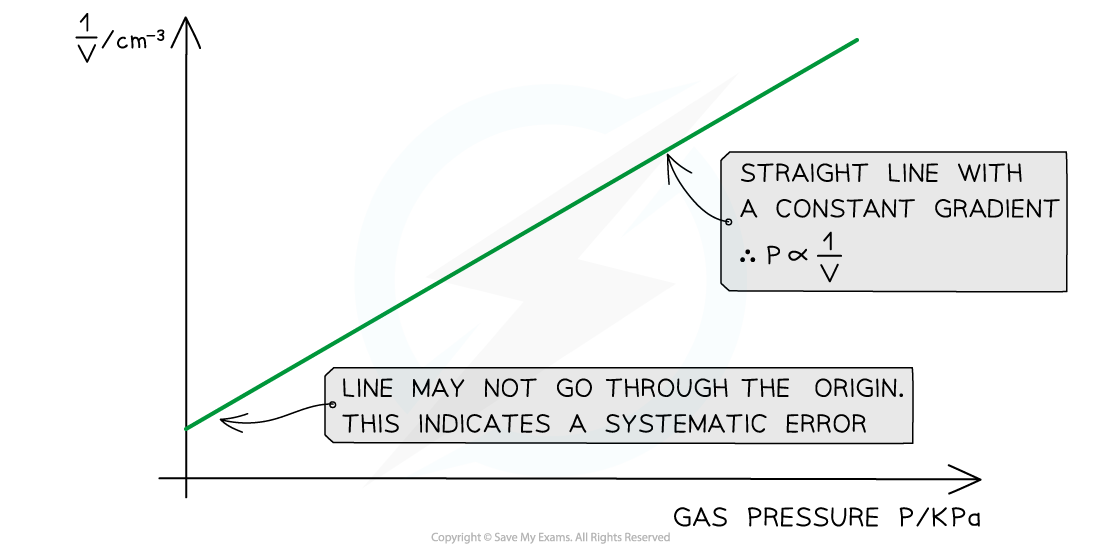
- Plot a graph of p against 1 / V and draw a line of best fit
- If this plot is a straight line graph, this means that the pressure is proportional to the inverse of the volume, hence confirming Boyle's Law (pV = constant)
Evaluating the Experiment
Systematic Errors:
- There may be friction in the syringe which causes a systematic error
- Use a syringe that has very little friction or lubricated it, so the only force is from the weights pulling the syringe downwards
Random Errors:
- The reading of the volume should be taken a few seconds after the mass has been added to the holder
- Otherwise, a reading will be taken when the temperature is not constant
- This experiment is prone to many random errors with the equipment and surrounding temperature
- Make sure to take repeat readings to decrease the effect of these
Safety Considerations
- A counterweight or G-clamp must be used to avoid the stand toppling over and causing injury, especially if the surface is not completely flat
Investigating Charles's Law
- The overall aim of this experiment is to investigate the effects of Charles’s law, which is the effect of volume on temperature at constant pressure
- This is just one example of how this required practical might be tackled
Variables
- Independent variable = Temperature, T (°C)
- Dependent variable = Height of the gas, h (cm)
- Control variables:
- Pressure
Equipment List

- Resolution of measuring equipment:
- 30 cm ruler = 1 mm
- 2 litre beaker = 50 ml
Method

Apparatus setup for Charles’s Law
- The capillary tube should have one open end at the top and a closed end at the bottom. This is to keep the pressure at atmospheric pressure, and constant. Assume the temperature of the water is the same as the temperature of the gas
- Set up the apparatus as shown in the diagram. Make sure the drop of sulfuric acid is halfway up the tube
- Boil some water in a kettle and pour it into the beaker for the full 2 litres. Make sure the water covers all the gas, and stir well
- When the temperature goes down to 95 °C, read the height of the gas from the ruler Make sure this value is read from eye level on the ruler
- Record the height of the gas as the temperature decreases in increments of 5 °C. Make sure you have at least 8 readings or down to room temperature
- An example table of results might look like:

Analysing the Results
- Plot a graph of the height of the gas in cm and the temperature in °C
- Draw a line of best fit
- Calculate the gradient

- If this is a straight-line graph, then this means the temperature is proportional to the height. Since the height is proportional to the volume (V = πr2h) then this means Charles’s law is confirmed, and the temperature is proportional to the volume too
- To find a value of absolute zero T0, the equation of the graph can be written as
h = mT + c
- Comparing this to the equation of a straight line: y = mx + c
- y = h
- x = T
- m = gradient
- c = y-intercept
- Plot a graph of the height of the gas in cm and the temperature in °C
- Draw a line of best fit
- Calculate the gradient
- Since c is a constant:
h0 - mT0 = h1 - mT1
- At absolute zero, h0 = 0
- mT0 = h1 - mT1

- Picking any co-ordinate of h and t from the line of best fit, and substituting into the equation will give a value of absolute zero
- Check this value is close to the accepted value of –273°C
Evaluating the Experiment
Systematic Errors:
- Make sure the capillary tube is close to the ruler and properly aligned to get an accurate value of the height of the gas
- Otherwise, the reading taken will be slightly out each time
Random Errors:
- Although this is a slower process, the experiment can be repeated by measuring the height as the gas cools instead
- There can be parallax error when taking the temperature and height readings by reading them at eye level
- Stir the water well so it is the same temperature throughout the beaker, and so the gas is the same temperature as well
Safety Considerations
- When using boiling water, make sure not to spill it onto your skin or any electrical equipment
- Make sure the bench is protected with a heat-proof mat so the boiling water does not damage the surface
Worked example
A student investigates the relationship between the temperature and volume of a column of air. They obtain the following results:
 Calculate the value of absolute zero from these results and its relative percentage error with the accepted value of –273.15 °C
Step 1: Plot a graph of temperature T against volume V

- Make sure the axes are properly labelled and the line of best fit is drawn with a ruler
Step 2: Calculate the gradient of the graph

- The gradient is calculated by:

Step 3: Calculate the value of absolute zero
- Where T0 is absolute zero and (T1, h1) is any co-ordinate on the line of best fit
- Using the coordinates (60, 10.6):

Step 4: Calculate its relative percentage error with the accepted value of –273.15 °C


