Energy in SHM
-
Simple harmonic motion also involves an interplay between different types of energy: potential and kinetic
-
The swinging of a pendulum is an interplay between gravitational potential energy and kinetic energy
- The horizontal oscillation of a mass on a spring is an interplay between elastic potential energy and kinetic energy
-
Energy of a Horizontal Mass-Spring System
- When held so the spring is stretched beyond its equilibrium position there is the maximum amount of elastic potential energy
- When the mass is released it moves back towards the equilibrium position, accelerating as it goes causing the kinetic energy to increase
- At the equilibrium position, kinetic energy is at its maximum and elastic potential energy is at its minimum
- Once past the equilibrium position the kinetic energy decreases and elastic potential energy increases
Energy of a Simple-Pendulum
- At the amplitude top of the swing, the pendulum has a maximum amount of gravitational potential energy
- When the pendulum is released, it moves back towards the equilibrium position, accelerating as it goes and the kinetic energy increases
- As the height of the pendulum decreases the gravitational potential energy also decreases
- Once the mass has passed the equilibrium position kinetic energy decreases and gravitational potential energy increases
Total Energy
-
The total energy remains constant, but the amount of energy in one form goes up, while the amount of energy in the other form goes down
-
This constant total energy shows how energy in a closed system is never created or destroyed; it is transferred from one store to another
-
This is the law of conservation of energy
-
The total energy of a simple harmonic system always remains constant and is equal to the sum of the kinetic and potential energy
- The total energy is calculated using the equation:
E = EP + EK
- Where:
- E = total energy in joules (J)
- EP = potential energy in joules (J)
- EK = kinetic energy in joules (J)
Energy-Displacement Graph
- The kinetic and potential energy transfers go through two complete cycles during one period of oscillation
- One complete oscillation reaches the maximum displacement twice (on both the positive and negative side of the equilibrium position)
- You need to be familiar with the graph showing the total, potential and kinetic energy transfers in half an SHM oscillation (half a cycle)

Graph showing the potential and kinetic energy against displacement in half a period of an SHM oscillation
- The key features of the energy-displacement graph are:
- Displacement is a vector, so, the graph has both positive and negative x values
- The potential energy is always maximum at the amplitude positions x = A, and 0 at the equilibrium position x = 0
- This is represented by a ‘U’ shaped curve
- The kinetic energy is the opposite: it is 0 at the amplitude positions x = A, and maximum at the equilibrium position x = 0
- This is represented by an ‘n’ shaped curve
- The total energy is represented by a horizontal straight line above the curves
Energy-Time Graph
- You also need to be familiar with the graph showing the total, gravitational potential and kinetic energy transfers against time for multiple cycles of a pendulum in simple harmonic motion
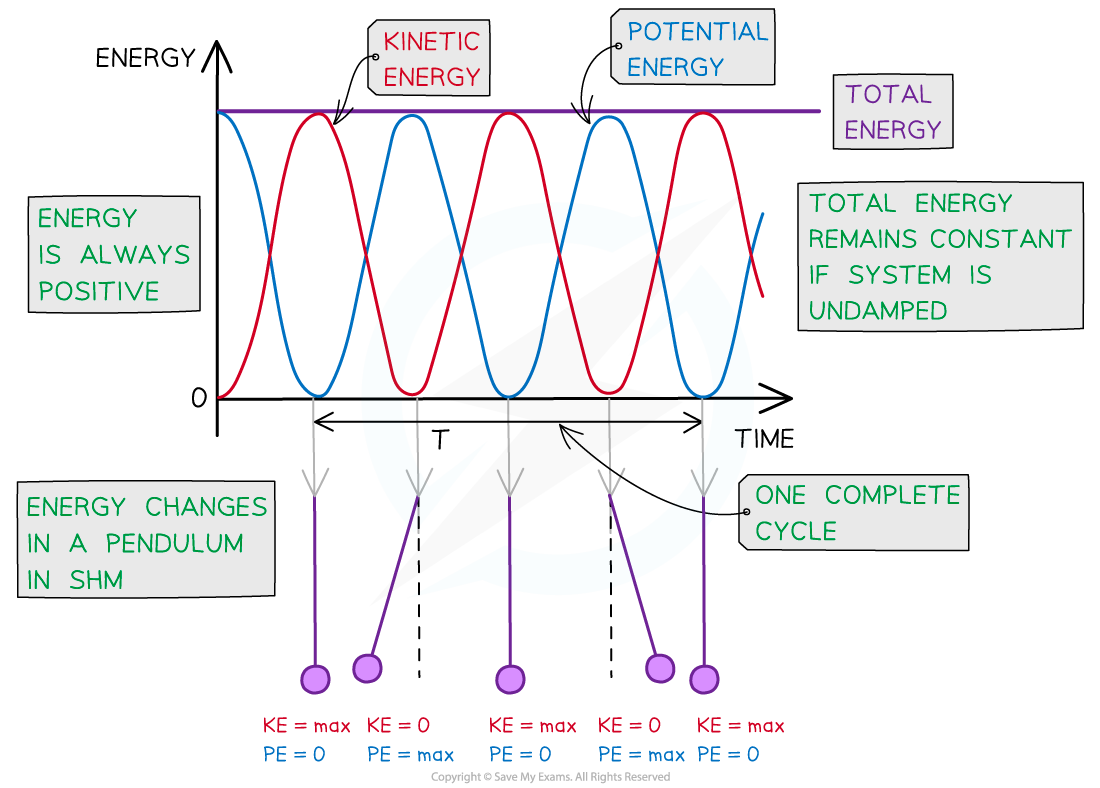
The kinetic and gravitational potential energy of a simple pendulum oscillating in SHM vary periodically
- The key features of the energy-time graph are:
- Both the kinetic and potential energy transfers are represented by periodic functions (sine or cosine) which vary in opposite directions to one another
- When the potential energy is 0, the kinetic energy is at its maximum point and vice versa
- The total energy is represented by a horizontal straight line directly above the curves at the maximum kinetic and potential energy value
- Energy is always positive so there are no negative values on the y axis
Exam Tip
You may be expected to draw as well as interpret energy graphs against time or displacement in exam questions. Make sure the sketches of the curves are as even as possible and use a ruler to draw straight lines, for example, to represent the total energy.

