Relationships between Variables
- Identifying the relationship between two variables shows how one variable changes with another
- This is best figured out from an equation that links both variables together
- Two variables can be:
- Directly proportional
- Inversely proportional
- For two variables, y and x that are directly proportional, their relationship looks like:
y ∝ x
- This means that as y increases, x also increases at the same rate (and vice versa)
- An example of this is
F = ma
- Since m is a constant, F and a are directly proportional
- If a is doubled, then so is F
- For two variables, y and x that are inversely proportional, this looks like:
y ∝ 
- This means that as y increases, x decreases at the same rate (or vice versa)
- An example of this is
R = 
- If V is constant, then R and I are inversely proportional
- If I is doubled, the R is halved
- It is important to note that in both of these examples, the remaining variable is constant, this is important to consider and check before stating the relationship between two variables
- In F = ma, if m changed as well with a then F would not increase by the same amount as a (i.e. it would no longer be directly proportional)
- Therefore, the directly proportional relationship can be turned into an equation by replacing '∝' with an '=' sign, and adding a constant k
y = kx
- This now means that as y increases, x increases with the amount determined by the constant k
- If k is 3 then y = 3x so the both increase by a factor of 3
- The same happens for an inversely proportional relationship
y = 
- This now means that as y increases, x increases with the amount determined by the constant k
- If k is 3 then y =
 so y decreases by a factor of 3
- If k is 3 then y =
- Another common relationship is the inverse square law
- For two variables, y and x that are related by the inverse square law, this looks like:
y ∝ 
- This means that if x increases by a factor of 2, then y decreases by a factor of 22 = 4!
- An example of this is
F = format('truetype')%3Bfont-weight%3Anormal%3Bfont-style%3Anormal%3B%7D%3C%2Fstyle%3E%3C%2Fdefs%3E%3Cline%20stroke%3D%22%23000000%22%20stroke-linecap%3D%22square%22%20stroke-width%3D%221%22%20x1%3D%222.5%22%20x2%3D%2242.5%22%20y1%3D%2223.5%22%20y2%3D%2223.5%22%2F%3E%3Ctext%20font-family%3D%22Times%20New%20Roman%22%20font-size%3D%2218%22%20font-style%3D%22italic%22%20text-anchor%3D%22middle%22%20x%3D%2222.5%22%20y%3D%2216%22%3EL%3C%2Ftext%3E%3Ctext%20font-family%3D%22Times%20New%20Roman%22%20font-size%3D%2218%22%20text-anchor%3D%22middle%22%20x%3D%228.5%22%20y%3D%2242%22%3E4%3C%2Ftext%3E%3Ctext%20font-family%3D%22math1437d7d1d97917cd627a34a6a0f%22%20font-size%3D%2216%22%20text-anchor%3D%22middle%22%20x%3D%2219.5%22%20y%3D%2242%22%3E%26%23x3C0%3B%3C%2Ftext%3E%3Ctext%20font-family%3D%22Times%20New%20Roman%22%20font-size%3D%2218%22%20text-anchor%3D%22middle%22%20x%3D%2229.5%22%20y%3D%2242%22%3Ed%3C%2Ftext%3E%3Ctext%20font-family%3D%22Times%20New%20Roman%22%20font-size%3D%2213%22%20text-anchor%3D%22middle%22%20x%3D%2237.5%22%20y%3D%2237%22%3E2%3C%2Ftext%3E%3C%2Fsvg%3E)
- If L is constant, then d and F are inversely proportional
- If the distance d is 3 times larger, then the flux intensity, F is 32 = 9 times smaller
Worked example
A student collects the following data of the count rate on a geiger counter increasing in distance from a gamma ray source.
| Distance d / cm | Count rate C / counts min-1 |
| 10 | 512 |
| 20 | 128 |
| 30 | 57 |
| 40 | 32 |
Show that the relationship between distance and count rate is an inverse square law relationship.
1. State the inverse square law relationship
-
- The count rate is inversely proportional to the distance squared
C ∝
2. Change relationship into an equation
C = 
3. Rearrange for constant, k
k = Cd2
4. Show all pairs of C and d have the same constant, k
Row 1: k = 512 × (10)2 = 51200
Row 2: k = 128 × (20)2 = 51200
Row 3: k = 57 × (30)2 = 51300
Row 4: k = 32 × (40)2 = 51200
5. Comment on constant and refer back to relationship
-
- Since all values have the same constant k to 2 significant figures (51000), C and d have an inverse square law relationship
Exam Tip
When you're comparing two variables you must check whether the other variables are constant before declaring that they're inversely or directly proportional. Otherwise, one will not increase at the same rate as the other, which goes against the definition!
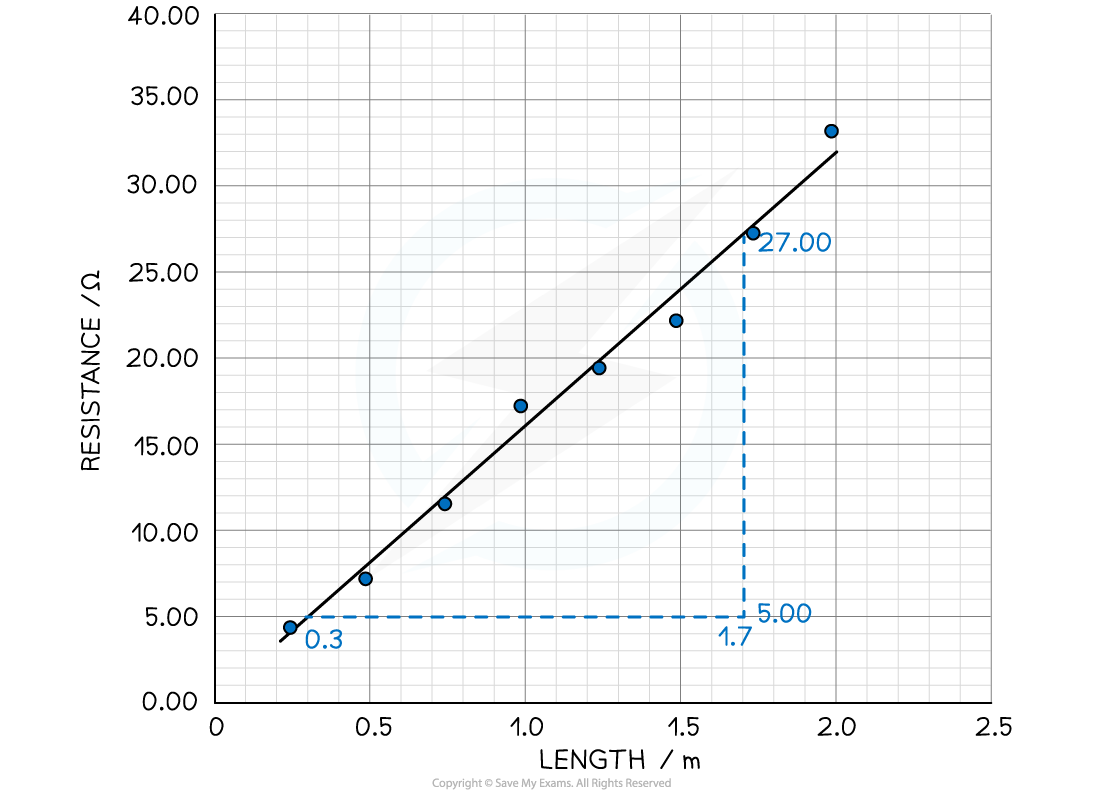
format('truetype')%3Bfont-weight%3Anormal%3Bfont-style%3Anormal%3B%7D%3C%2Fstyle%3E%3C%2Fdefs%3E%3Cline%20stroke%3D%22%23000000%22%20stroke-linecap%3D%22square%22%20stroke-width%3D%221%22%20x1%3D%222.5%22%20x2%3D%2295.5%22%20y1%3D%2223.5%22%20y2%3D%2223.5%22%2F%3E%3Ctext%20font-family%3D%22Times%20New%20Roman%22%20font-size%3D%2218%22%20text-anchor%3D%22middle%22%20x%3D%2213.5%22%20y%3D%2216%22%3E27%3C%2Ftext%3E%3Ctext%20font-family%3D%22math1bb9cd9f0f4f5021339054f0f76%22%20font-size%3D%2216%22%20text-anchor%3D%22middle%22%20x%3D%2224.5%22%20y%3D%2216%22%3E.%3C%2Ftext%3E%3Ctext%20font-family%3D%22Times%20New%20Roman%22%20font-size%3D%2218%22%20text-anchor%3D%22middle%22%20x%3D%2236.5%22%20y%3D%2216%22%3E00%3C%2Ftext%3E%3Ctext%20font-family%3D%22math1bb9cd9f0f4f5021339054f0f76%22%20font-size%3D%2216%22%20text-anchor%3D%22middle%22%20x%3D%2253.5%22%20y%3D%2216%22%3E%26%23x2212%3B%3C%2Ftext%3E%3Ctext%20font-family%3D%22Times%20New%20Roman%22%20font-size%3D%2218%22%20text-anchor%3D%22middle%22%20x%3D%2266.5%22%20y%3D%2216%22%3E5%3C%2Ftext%3E%3Ctext%20font-family%3D%22math1bb9cd9f0f4f5021339054f0f76%22%20font-size%3D%2216%22%20text-anchor%3D%22middle%22%20x%3D%2273.5%22%20y%3D%2216%22%3E.%3C%2Ftext%3E%3Ctext%20font-family%3D%22Times%20New%20Roman%22%20font-size%3D%2218%22%20text-anchor%3D%22middle%22%20x%3D%2285.5%22%20y%3D%2216%22%3E00%3C%2Ftext%3E%3Ctext%20font-family%3D%22Times%20New%20Roman%22%20font-size%3D%2218%22%20text-anchor%3D%22middle%22%20x%3D%2222.5%22%20y%3D%2241%22%3E1%3C%2Ftext%3E%3Ctext%20font-family%3D%22math1bb9cd9f0f4f5021339054f0f76%22%20font-size%3D%2216%22%20text-anchor%3D%22middle%22%20x%3D%2229.5%22%20y%3D%2241%22%3E.%3C%2Ftext%3E%3Ctext%20font-family%3D%22Times%20New%20Roman%22%20font-size%3D%2218%22%20text-anchor%3D%22middle%22%20x%3D%2236.5%22%20y%3D%2241%22%3E7%3C%2Ftext%3E%3Ctext%20font-family%3D%22math1bb9cd9f0f4f5021339054f0f76%22%20font-size%3D%2216%22%20text-anchor%3D%22middle%22%20x%3D%2249.5%22%20y%3D%2241%22%3E%26%23x2212%3B%3C%2Ftext%3E%3Ctext%20font-family%3D%22Times%20New%20Roman%22%20font-size%3D%2218%22%20text-anchor%3D%22middle%22%20x%3D%2262.5%22%20y%3D%2241%22%3E0%3C%2Ftext%3E%3Ctext%20font-family%3D%22math1bb9cd9f0f4f5021339054f0f76%22%20font-size%3D%2216%22%20text-anchor%3D%22middle%22%20x%3D%2269.5%22%20y%3D%2241%22%3E.%3C%2Ftext%3E%3Ctext%20font-family%3D%22Times%20New%20Roman%22%20font-size%3D%2218%22%20text-anchor%3D%22middle%22%20x%3D%2276.5%22%20y%3D%2241%22%3E3%3C%2Ftext%3E%3C%2Fsvg%3E)

