Plotting Graphs
- When plotting graphs, it is important to consider the importance of the following factors:
- Selecting appropriate scales
- Labelling axes with quantities and units
- Carefully plotting the points
Choice of Scale
- When choosing a scale, it must be big enough to accommodate all the collected values using as much of the graph paper as possible
- At least half of the graph grid should be occupied in both the x and y directions
- Scales should be clearly indicated and have suitable, sensible ranges that are easy to work with
- For example, scales with multiples of 3 should be avoided
- The scales should increase outwards and upwards from the origin
- Each axis should be labelled with the quantity that is being plotted, along with the correct unit
Labelling the Axes
- Label each axis with the name of the quantity and its unit
- For example, F / N means force measured in Newtons
- The convention is that a forward slash ( / ) is used to separate the quantity and the unit
- In general:
- The independent variable goes on the x-axis
- The dependent variable goes on the y-axis
Example of labelled axes with the name of the variable, its symbol and its unit
Plotting the Points
- Points should be plotted so that they all fit on the graph grid and not outside it
- All values should be plotted, and the points must be precise to within half a small square
- Points must be clear, and not obscured by the line of best fit, and they need to be plotted with a sharp pencil so that they are thin
- There should be at least six points plotted on the graph, with any major outliers identified
Line or Curve of Best Fit
- There should be equal numbers of points above and below the line of best fit
- Using a clear plastic ruler will help with this
- Not all lines will pass through the origin and nor should they be forced to
- The line (or curve) of best fit should not be too thick or joined dot-to-dot like a frequency polygon
- Anomalous values that have not been identified during the implementation stage should be ignored if they are obviously incorrect
- This is because they will have a large effect on the gradient of the line of best fit
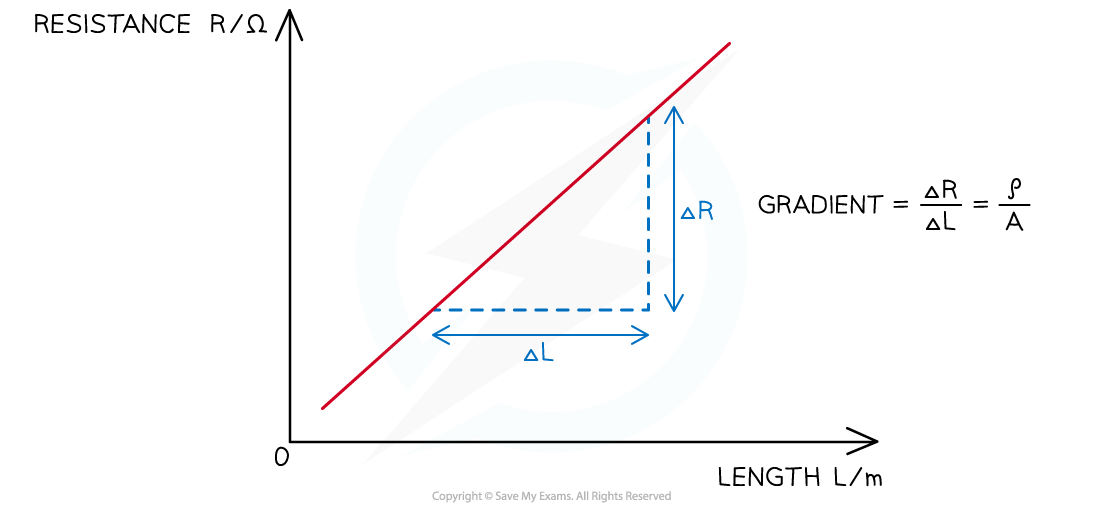
Determining the y-intercept
- The y-intercept is the y value obtained where the line crosses the y-axis at x = 0
- Values should be read accurately from the graph, with the scale on the y-axis being interpreted correctly
Worked example
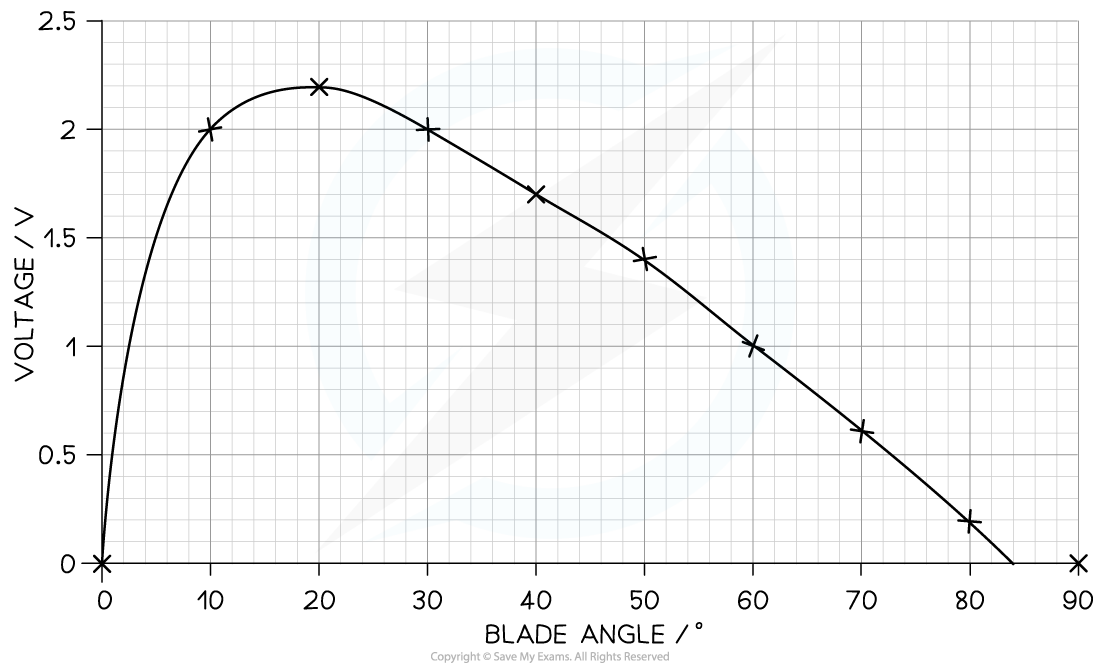
A student investigates the effect of placing an electric fan in front of a wind turbine. The wind turbine is connected to a voltmeter. When the wind turbine turns, it generates a voltage. The student obtains the following results: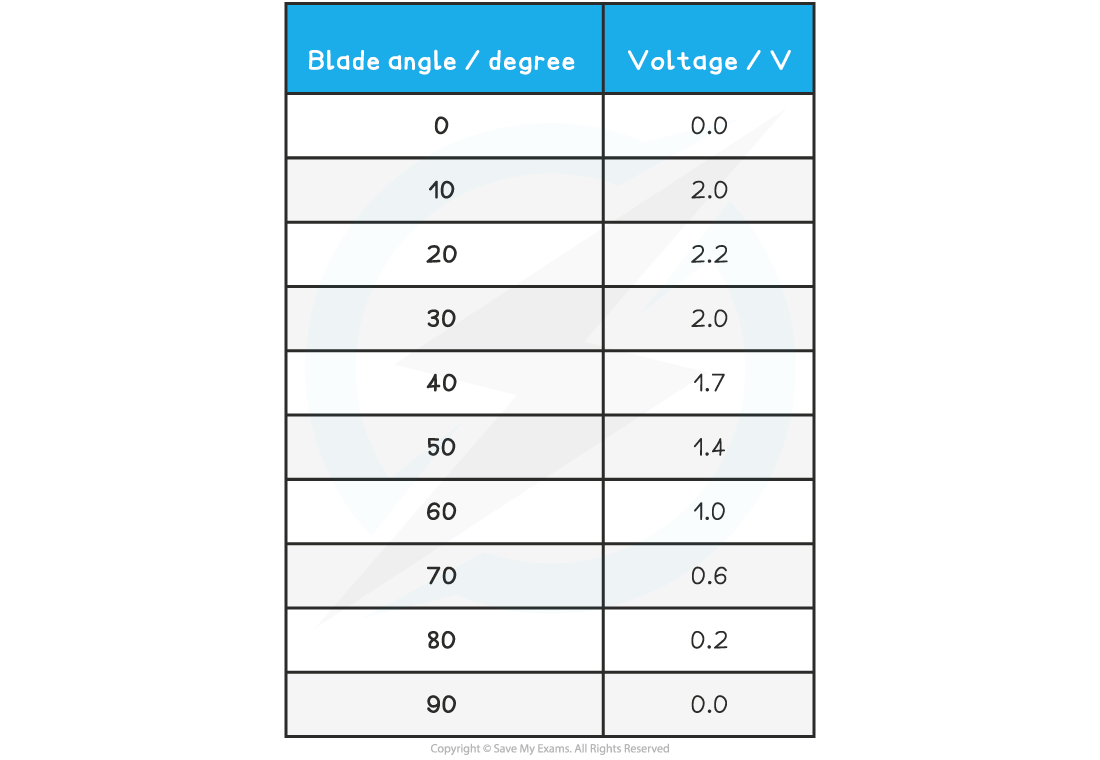 Plot the student’s results on the grid and draw a curve of best fit on the graph.
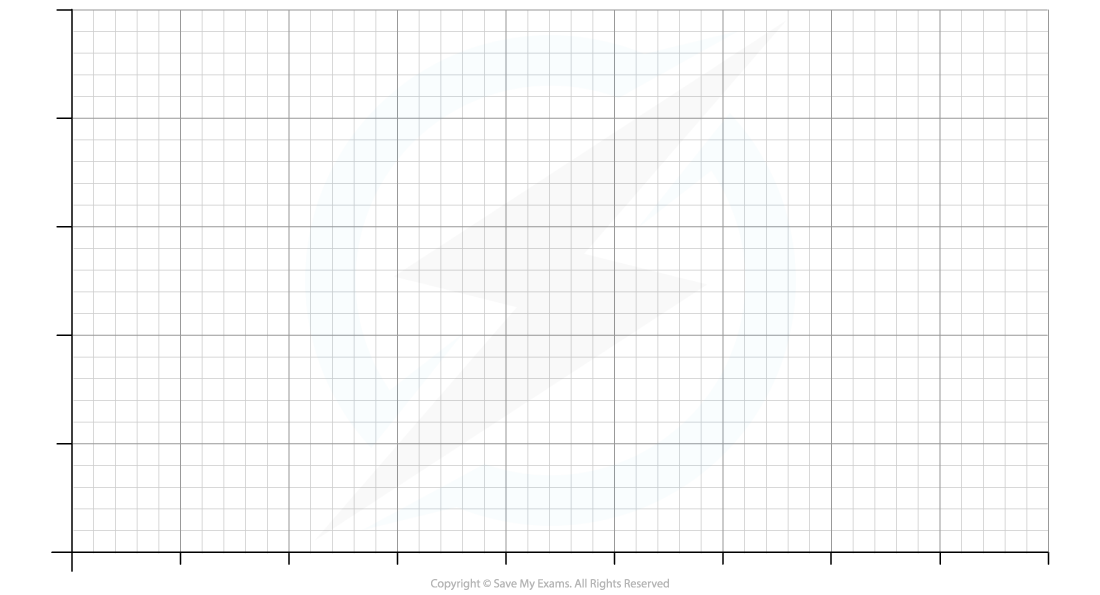
Step 1: Identify the independent and dependent variables
-
- Independent variable = blade angle / °
- Dependent variable = voltage / V
Step 2: Choose an appropriate scale
-
- The range of the blade angle is 0 – 90°
- Ideally, every small square represents 10°
-
- The range of the voltage is 0 – 2.2 V
- Ideally, each small square represents 0.5 V
-
- Both axes should occupy at least 50% of the grid
Step 3: Label the axes
-
- The dependent variable (voltage / V) goes on the y-axis
- The independent variable (blade angle / °) goes on the x-axis
- Both axes should be labelled with a quantity and a unit
Step 4: Plot the points
-
- Each point should be accurate within half a small square
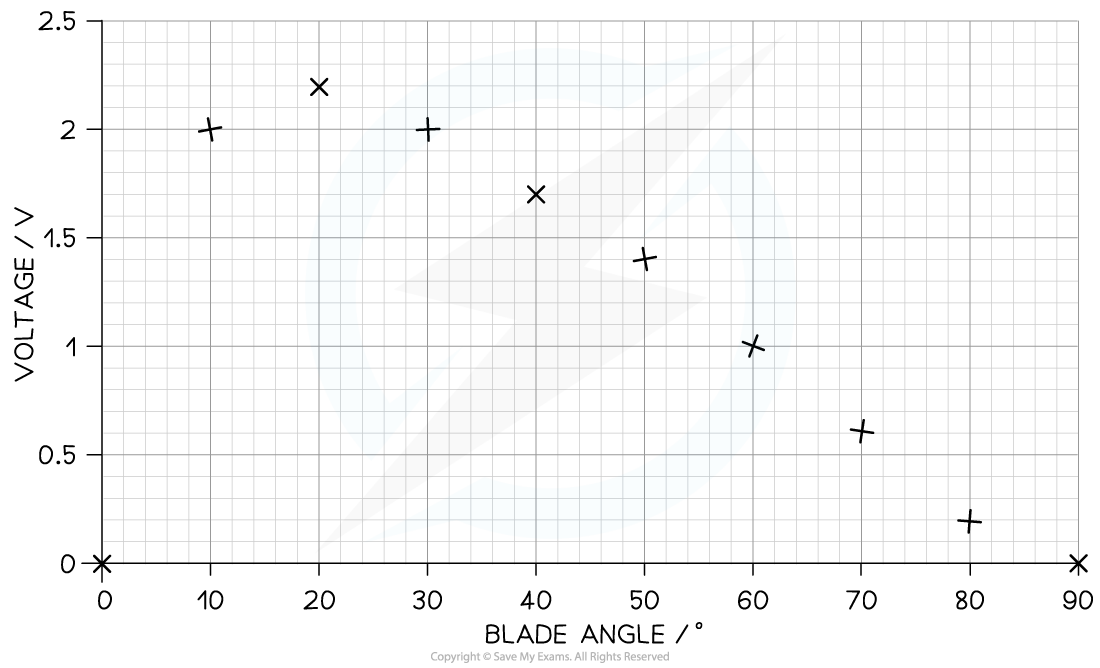
Step 5: Draw a curve of best fit
-
- The curve should be smooth with a roughly equal distribution of points on either side of the curve
- It must start at (0,0) and peak at (20, 2.2)
Exam Tip
Remember that 'sketching' and 'plotting' a graph are two different command words
- 'Sketch' means – Produce a freehand drawing. For a graph, this would require a line and labelled axis with important features indicated, the axes are not scaled.
- 'Plot' means – Produce a graph by marking points accurately on a grid from data that is provided and then drawing a line of best fit through these points. A suitable scale and appropriately labelled axes must be included if these are not provided in the question
The difference between these two command words is the use of scales. A plotted graph has a scaled axes, whilst a sketch doesn't have to be but both times the axes should be clearly labelled

