Calibrating Instruments
- Calibration is a comparison between a known measurement and the measurement you achieve using the instrument
- This checks the accuracy of the instrument, especially for higher readings
- An example is checking whether a meter (e.g., voltmeter, micrometer, ammeter) reads zero before measurements are made
- This helps avoid zero error
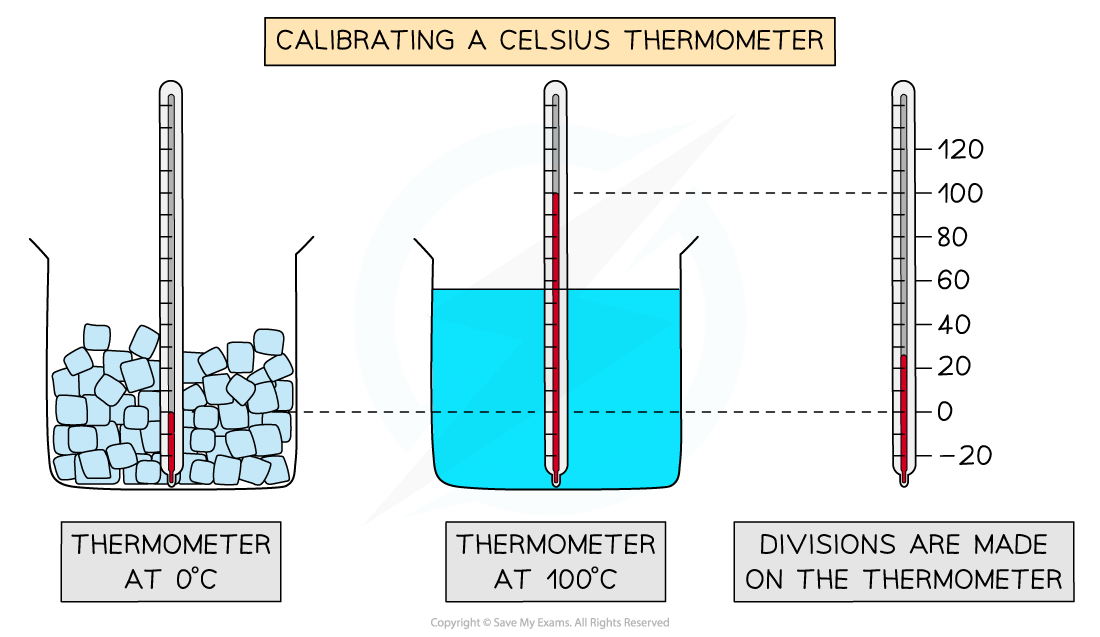
- To calibrate a thermometer means to put the correct mark of readings at the correct place so that other temperatures can be deduced from these marks
- An uncalibrated thermometer may not read 0 °C for the freezing point of water, or 100 °C for its boiling point, but we know these values to be accurate
Calibration Curves
- Calibration curves are used to convert measurements made on one measurement scale to another measurement scale
- These are useful in experiments when the instruments used have outputs which are not proportional to the value they are measuring
- e.g. e.m.f and temperature (thermocouple) or resistance against temperature (thermistor)
- For example, the calibration curve for a thermocouple, in which the e.m.f varies with temperature, is shown below:
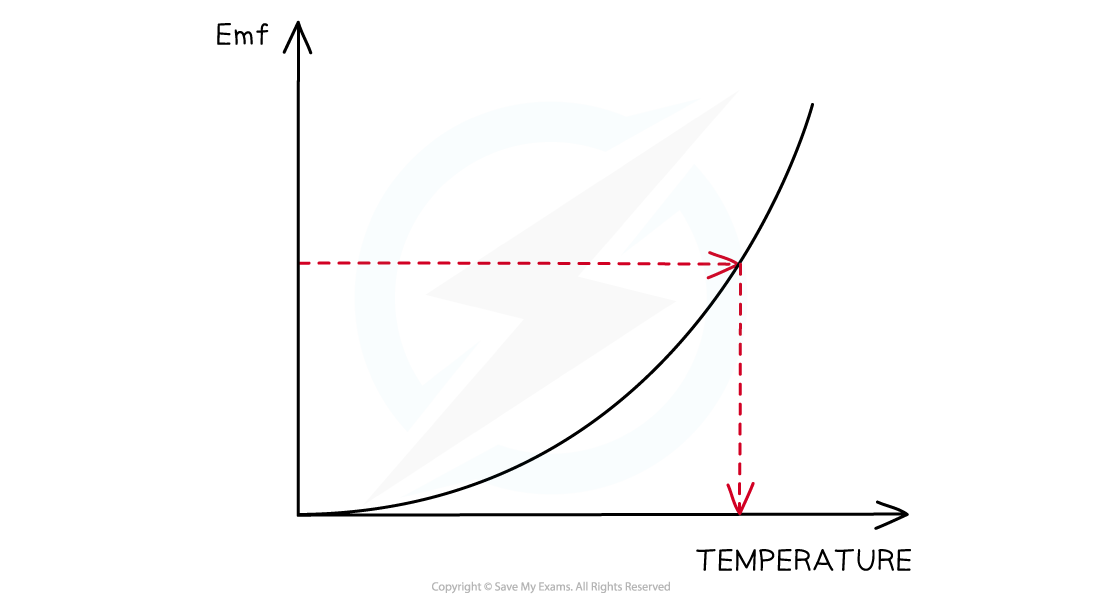
A curve of voltage against temperature can be used as a temperature sensor
- The calibration curve for a thermistor looks like:
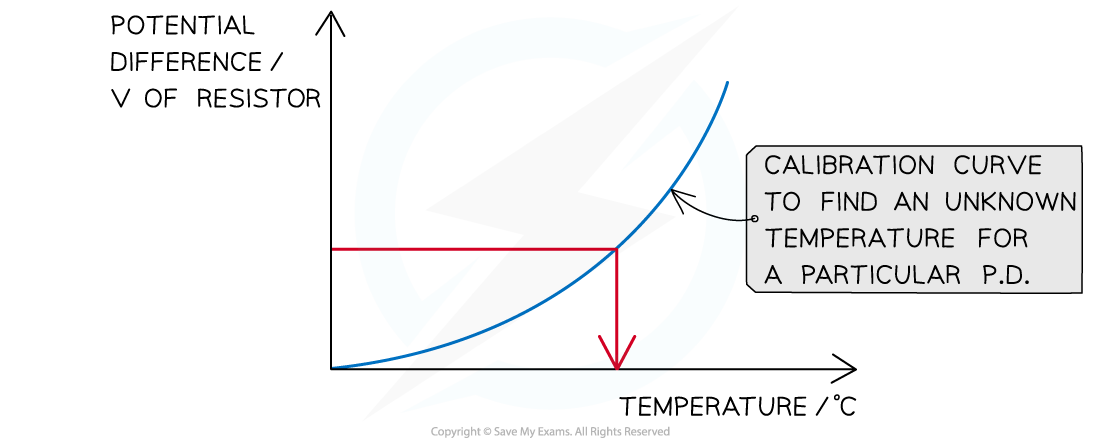
Thermistor calibration curve
- The accuracy of all measuring devices degrades over time. This is typically caused by normal wear and tear
- Calibration improves the accuracy of the measuring device
Worked example
A voltmeter gives readings that are larger than the true values and has a systematic error that varies with voltage.Which graph shows the calibration curve for the voltmeter?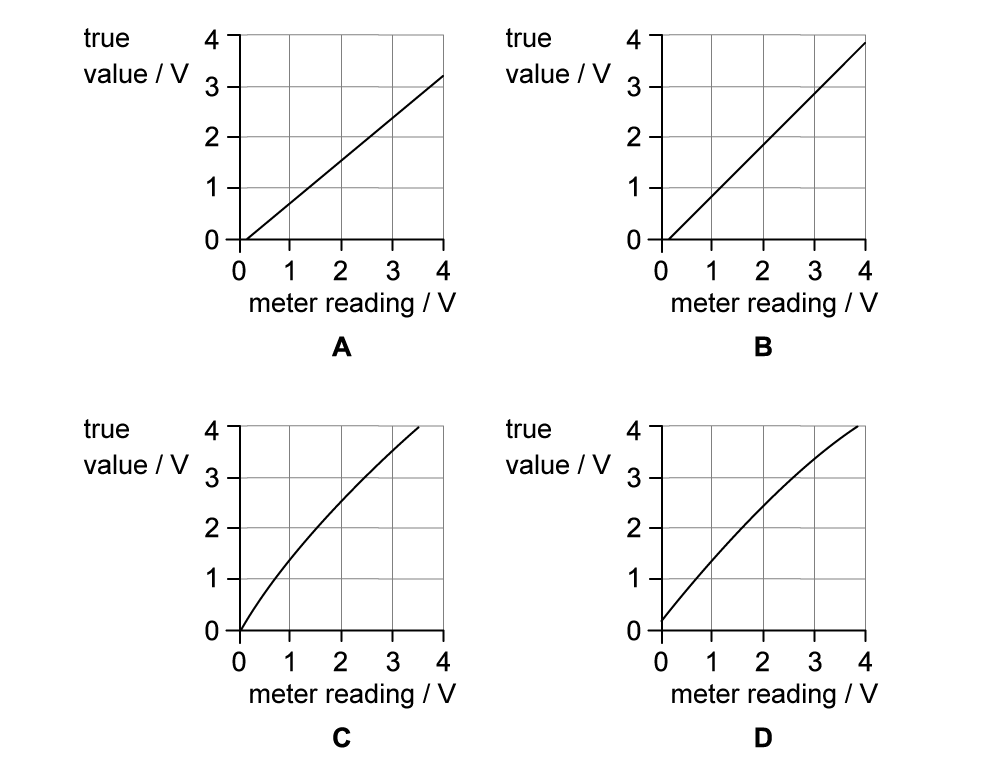
ANSWER: A
- The voltmeter has a systematic error as the reading it gives is always greater than the true value
- If the true value is zero, the voltmeter would give a value greater than zero
- Therefore, the curve doesn’t pass through the origin (0,0) as this would indicate that the reading is the same as the true value, and not greater - this rule out graph C
- So, when the true value is zero, the meter would give a reading greater than zero. This is either graph A or B
- The systematic error varies with voltage
- So, the amount by which the meter reading is greater than the true value changes
- Therefore, graph A is correct, because the difference between the meter reading and the true value increases with voltage
Exam Tip
You will be expected to use a calibration curve for the Core Practical 12: Calibrate a thermistor in a potential divider circuit as a thermostat

