Distance-Time & Speed-Time Graphs (OCR GCSE Maths)
Revision Note

Author
Daniel IExpertise
Maths
Distance-Time Graphs
How does a distance-time graph work?
- Distance-time graphs show distance from a fixed point at different times
- Distance is on the vertical axis, and time is on the horizontal axis.
- The gradient of the graph is the speed
- A positive gradient represents the object (or person) moving away from the starting point
- If the graph is a horizontal line the object is stationary (not moving)
- A negative gradient represents the object (or person) moving towards the starting point
- If the graph is a straight line the speed is constant
- If the graph is a curve you can find an estimate of the speed at a point by drawing the tangent at a point on the graph and find its gradient
- To find the average speed through a period of time, divide the total distance in that time period by the total time
format('truetype')%3Bfont-weight%3Anormal%3Bfont-style%3Anormal%3B%7D%3C%2Fstyle%3E%3C%2Fdefs%3E%3Ctext%20font-family%3D%22Times%20New%20Roman%22%20font-size%3D%2218%22%20text-anchor%3D%22middle%22%20x%3D%2220.5%22%20y%3D%2230%22%3Espeed%3C%2Ftext%3E%3Ctext%20font-family%3D%22math17f39f8317fbdb1988ef4c628eb%22%20font-size%3D%2216%22%20text-anchor%3D%22middle%22%20x%3D%2253.5%22%20y%3D%2230%22%3E%3D%3C%2Ftext%3E%3Cline%20stroke%3D%22%23000000%22%20stroke-linecap%3D%22square%22%20stroke-width%3D%221%22%20x1%3D%2268.5%22%20x2%3D%22130.5%22%20y1%3D%2223.5%22%20y2%3D%2223.5%22%2F%3E%3Ctext%20font-family%3D%22Times%20New%20Roman%22%20font-size%3D%2218%22%20text-anchor%3D%22middle%22%20x%3D%2299.5%22%20y%3D%2216%22%3Edistance%3C%2Ftext%3E%3Ctext%20font-family%3D%22Times%20New%20Roman%22%20font-size%3D%2218%22%20text-anchor%3D%22middle%22%20x%3D%22100.5%22%20y%3D%2241%22%3Etime%3C%2Ftext%3E%3Ctext%20font-family%3D%22math17f39f8317fbdb1988ef4c628eb%22%20font-size%3D%2216%22%20text-anchor%3D%22middle%22%20x%3D%22145.5%22%20y%3D%2230%22%3E%3D%3C%2Ftext%3E%3Cline%20stroke%3D%22%23000000%22%20stroke-linecap%3D%22square%22%20stroke-width%3D%221%22%20x1%3D%22160.5%22%20x2%3D%22189.5%22%20y1%3D%2223.5%22%20y2%3D%2223.5%22%2F%3E%3Ctext%20font-family%3D%22Times%20New%20Roman%22%20font-size%3D%2218%22%20text-anchor%3D%22middle%22%20x%3D%22175.5%22%20y%3D%2216%22%3Erise%3C%2Ftext%3E%3Ctext%20font-family%3D%22Times%20New%20Roman%22%20font-size%3D%2218%22%20text-anchor%3D%22middle%22%20x%3D%22175.5%22%20y%3D%2241%22%3Erun%3C%2Ftext%3E%3C%2Fsvg%3E)
format('truetype')%3Bfont-weight%3Anormal%3Bfont-style%3Anormal%3B%7D%3C%2Fstyle%3E%3C%2Fdefs%3E%3Ctext%20font-family%3D%22Times%20New%20Roman%22%20font-size%3D%2218%22%20text-anchor%3D%22middle%22%20x%3D%2228.5%22%20y%3D%2230%22%3Eaverage%3C%2Ftext%3E%3Ctext%20font-family%3D%22Times%20New%20Roman%22%20font-size%3D%2218%22%20text-anchor%3D%22middle%22%20x%3D%2280.5%22%20y%3D%2230%22%3Espeed%3C%2Ftext%3E%3Ctext%20font-family%3D%22math17f39f8317fbdb1988ef4c628eb%22%20font-size%3D%2216%22%20text-anchor%3D%22middle%22%20x%3D%22109.5%22%20y%3D%2230%22%3E%3D%3C%2Ftext%3E%3Cline%20stroke%3D%22%23000000%22%20stroke-linecap%3D%22square%22%20stroke-width%3D%221%22%20x1%3D%22120.5%22%20x2%3D%22218.5%22%20y1%3D%2223.5%22%20y2%3D%2223.5%22%2F%3E%3Ctext%20font-family%3D%22Times%20New%20Roman%22%20font-size%3D%2218%22%20text-anchor%3D%22middle%22%20x%3D%22138.5%22%20y%3D%2216%22%3Etotal%3C%2Ftext%3E%3Ctext%20font-family%3D%22Times%20New%20Roman%22%20font-size%3D%2218%22%20text-anchor%3D%22middle%22%20x%3D%22187.5%22%20y%3D%2216%22%3Edistance%3C%2Ftext%3E%3Ctext%20font-family%3D%22Times%20New%20Roman%22%20font-size%3D%2218%22%20text-anchor%3D%22middle%22%20x%3D%22152.5%22%20y%3D%2241%22%3Etotal%3C%2Ftext%3E%3Ctext%20font-family%3D%22Times%20New%20Roman%22%20font-size%3D%2218%22%20text-anchor%3D%22middle%22%20x%3D%22188.5%22%20y%3D%2241%22%3Etime%3C%2Ftext%3E%3C%2Fsvg%3E)
Exam Tip
- It is easy to get confused between different types of graph.
- Look at the label on the vertical axis to make sure you are looking at a DISTANCE-time graph (not speed-time)
Worked example
One afternoon Mary cycled to her grandparents' house, 8 km from her own home.
Part of her travel graph for her journey is shown below.

Mary stayed at her grandparents' house for half an hour.
She then cycled home at a steady speed, without stopping, arriving home at 4 pm.
a)
Complete the travel graph for Mary's journey.
Begin by checking the scale on the time axis. Note that one square is 15 minutes.
Mary stays at her grandparents' house for 30 minutes, so draw a horizontal line for 2 squares to show this.
Her cycle home is represented by a straight line (steady speed) drawn from the end of her stay to 4pm on the time axis (where the distance from home is zero).

b)
For how long did Mary stop on the way to her grandparents' house?
Mary's stop on the way is the short horizontal line from 1.30 pm to 1.45 pm. The horizontal line is one square long so represents 15 minutes.
Mary stopped for 15 minutes.
c)
What is Mary's speed between 1.45 pm and 2.45 pm?
Speed can be found on a distance-time graph by finding the gradient of the line at that point.
format('truetype')%3Bfont-weight%3Anormal%3Bfont-style%3Anormal%3B%7D%3C%2Fstyle%3E%3C%2Fdefs%3E%3Ctext%20fill%3D%22%231BAEEB%22%20font-family%3D%22Times%20New%20Roman%22%20font-size%3D%2218%22%20text-anchor%3D%22middle%22%20x%3D%2220.5%22%20y%3D%2230%22%3Espeed%3C%2Ftext%3E%3Ctext%20fill%3D%22%231BAEEB%22%20font-family%3D%22math17f39f8317fbdb1988ef4c628eb%22%20font-size%3D%2216%22%20text-anchor%3D%22middle%22%20x%3D%2253.5%22%20y%3D%2230%22%3E%3D%3C%2Ftext%3E%3Cline%20stroke%3D%22%231BAEEB%22%20stroke-linecap%3D%22square%22%20stroke-width%3D%221%22%20x1%3D%2268.5%22%20x2%3D%22101.5%22%20y1%3D%2223.5%22%20y2%3D%2223.5%22%2F%3E%3Ctext%20fill%3D%22%231BAEEB%22%20font-family%3D%22Times%20New%20Roman%22%20font-size%3D%2218%22%20text-anchor%3D%22middle%22%20x%3D%2287.5%22%20y%3D%2216%22%3Erise%3C%2Ftext%3E%3Ctext%20fill%3D%22%231BAEEB%22%20font-family%3D%22Times%20New%20Roman%22%20font-size%3D%2218%22%20text-anchor%3D%22middle%22%20x%3D%2285.5%22%20y%3D%2241%22%3Erun%3C%2Ftext%3E%3Ctext%20fill%3D%22%231BAEEB%22%20font-family%3D%22math17f39f8317fbdb1988ef4c628eb%22%20font-size%3D%2216%22%20text-anchor%3D%22middle%22%20x%3D%22112.5%22%20y%3D%2230%22%3E%3D%3C%2Ftext%3E%3Cline%20stroke%3D%22%231BAEEB%22%20stroke-linecap%3D%22square%22%20stroke-width%3D%221%22%20x1%3D%22123.5%22%20x2%3D%22193.5%22%20y1%3D%2223.5%22%20y2%3D%2223.5%22%2F%3E%3Ctext%20fill%3D%22%231BAEEB%22%20font-family%3D%22Times%20New%20Roman%22%20font-size%3D%2218%22%20text-anchor%3D%22middle%22%20x%3D%22154.5%22%20y%3D%2216%22%3Edistance%3C%2Ftext%3E%3Ctext%20fill%3D%22%231BAEEB%22%20font-family%3D%22Times%20New%20Roman%22%20font-size%3D%2218%22%20text-anchor%3D%22middle%22%20x%3D%22159.5%22%20y%3D%2241%22%3Etime%3C%2Ftext%3E%3C%2Fsvg%3E)

format('truetype')%3Bfont-weight%3Anormal%3Bfont-style%3Anormal%3B%7D%3C%2Fstyle%3E%3C%2Fdefs%3E%3Ctext%20fill%3D%22%23ED4850%22%20font-family%3D%22Times%20New%20Roman%22%20font-size%3D%2218%22%20text-anchor%3D%22middle%22%20x%3D%2220.5%22%20y%3D%2230%22%3Espeed%3C%2Ftext%3E%3Ctext%20fill%3D%22%23ED4850%22%20font-family%3D%22math1930afe930c74b38ddd3804c196%22%20font-size%3D%2216%22%20text-anchor%3D%22middle%22%20x%3D%2253.5%22%20y%3D%2230%22%3E%3D%3C%2Ftext%3E%3Cline%20stroke%3D%22%23ED4850%22%20stroke-linecap%3D%22square%22%20stroke-width%3D%221%22%20x1%3D%2268.5%22%20x2%3D%22117.5%22%20y1%3D%2223.5%22%20y2%3D%2223.5%22%2F%3E%3Ctext%20fill%3D%22%23ED4850%22%20font-family%3D%22Times%20New%20Roman%22%20font-size%3D%2218%22%20text-anchor%3D%22middle%22%20x%3D%2279.5%22%20y%3D%2216%22%3E6%3C%2Ftext%3E%3Ctext%20fill%3D%22%23ED4850%22%20font-family%3D%22Times%20New%20Roman%22%20font-size%3D%2218%22%20text-anchor%3D%22middle%22%20x%3D%2299.5%22%20y%3D%2216%22%3Ekm%3C%2Ftext%3E%3Ctext%20fill%3D%22%23ED4850%22%20font-family%3D%22Times%20New%20Roman%22%20font-size%3D%2218%22%20text-anchor%3D%22middle%22%20x%3D%2274.5%22%20y%3D%2241%22%3E1%3C%2Ftext%3E%3Ctext%20fill%3D%22%23ED4850%22%20font-family%3D%22Times%20New%20Roman%22%20font-size%3D%2218%22%20text-anchor%3D%22middle%22%20x%3D%2299.5%22%20y%3D%2241%22%3Ehour%3C%2Ftext%3E%3Ctext%20fill%3D%22%23ED4850%22%20font-family%3D%22math1930afe930c74b38ddd3804c196%22%20font-size%3D%2216%22%20text-anchor%3D%22middle%22%20x%3D%22132.5%22%20y%3D%2230%22%3E%3D%3C%2Ftext%3E%3Ctext%20fill%3D%22%23ED4850%22%20font-family%3D%22Times%20New%20Roman%22%20font-size%3D%2218%22%20text-anchor%3D%22middle%22%20x%3D%22149.5%22%20y%3D%2230%22%3E6%3C%2Ftext%3E%3Ctext%20fill%3D%22%23ED4850%22%20font-family%3D%22Times%20New%20Roman%22%20font-size%3D%2218%22%20text-anchor%3D%22middle%22%20x%3D%22169.5%22%20y%3D%2230%22%3Ekm%3C%2Ftext%3E%3Ctext%20fill%3D%22%23ED4850%22%20font-family%3D%22math1930afe930c74b38ddd3804c196%22%20font-size%3D%2216%22%20text-anchor%3D%22middle%22%20x%3D%22186.5%22%20y%3D%2230%22%3E%2F%3C%2Ftext%3E%3Ctext%20fill%3D%22%23ED4850%22%20font-family%3D%22Times%20New%20Roman%22%20font-size%3D%2218%22%20text-anchor%3D%22middle%22%20x%3D%22196.5%22%20y%3D%2230%22%3Eh%3C%2Ftext%3E%3C%2Fsvg%3E)
6 km/h
Speed-Time Graphs
What is a speed-time graph?
- Speed-time graphs show speed at different times
- Speed is on the vertical axis, and time is on the horizontal axis
- The gradient of the graph is the acceleration
-
- If the graph is a curve you can
- estimate of the acceleration at a point by drawing the tangent at that point on the graph and finding its gradient
- find the average acceleration between two points by drawing a chord between the two points and finding its gradient
- A positive gradient shows positive acceleration (speeding up)
- A horizontal line on a speed-time graph shows constant speed (no acceleration)
- A negative gradient shows negative acceleration, or deceleration (slowing down)
format('truetype')%3Bfont-weight%3Anormal%3Bfont-style%3Anormal%3B%7D%3C%2Fstyle%3E%3C%2Fdefs%3E%3Ctext%20font-family%3D%22Times%20New%20Roman%22%20font-size%3D%2218%22%20text-anchor%3D%22middle%22%20x%3D%2246.5%22%20y%3D%2230%22%3EAcceleration%3C%2Ftext%3E%3Ctext%20font-family%3D%22math17f39f8317fbdb1988ef4c628eb%22%20font-size%3D%2216%22%20text-anchor%3D%22middle%22%20x%3D%22104.5%22%20y%3D%2230%22%3E%3D%3C%2Ftext%3E%3Cline%20stroke%3D%22%23000000%22%20stroke-linecap%3D%22square%22%20stroke-width%3D%221%22%20x1%3D%22119.5%22%20x2%3D%22163.5%22%20y1%3D%2223.5%22%20y2%3D%2223.5%22%2F%3E%3Ctext%20font-family%3D%22Times%20New%20Roman%22%20font-size%3D%2218%22%20text-anchor%3D%22middle%22%20x%3D%22141.5%22%20y%3D%2216%22%3Espeed%3C%2Ftext%3E%3Ctext%20font-family%3D%22Times%20New%20Roman%22%20font-size%3D%2218%22%20text-anchor%3D%22middle%22%20x%3D%22142.5%22%20y%3D%2241%22%3Etime%3C%2Ftext%3E%3Ctext%20font-family%3D%22math17f39f8317fbdb1988ef4c628eb%22%20font-size%3D%2216%22%20text-anchor%3D%22middle%22%20x%3D%22178.5%22%20y%3D%2230%22%3E%3D%3C%2Ftext%3E%3Cline%20stroke%3D%22%23000000%22%20stroke-linecap%3D%22square%22%20stroke-width%3D%221%22%20x1%3D%22193.5%22%20x2%3D%22222.5%22%20y1%3D%2223.5%22%20y2%3D%2223.5%22%2F%3E%3Ctext%20font-family%3D%22Times%20New%20Roman%22%20font-size%3D%2218%22%20text-anchor%3D%22middle%22%20x%3D%22208.5%22%20y%3D%2216%22%3Erise%3C%2Ftext%3E%3Ctext%20font-family%3D%22Times%20New%20Roman%22%20font-size%3D%2218%22%20text-anchor%3D%22middle%22%20x%3D%22208.5%22%20y%3D%2241%22%3Erun%3C%2Ftext%3E%3C%2Fsvg%3E)
- The distance covered can be found by finding the area under the graph
- If the graph is a curve you can estimate the distance covered by drawing trapeziums underneath the graph and finding their area
Exam Tip
- It is easy to get confused between different types of graph.
- Look at the label on the vertical axis to make sure you are looking at a SPEED-time graph (not distance-time)
Worked example
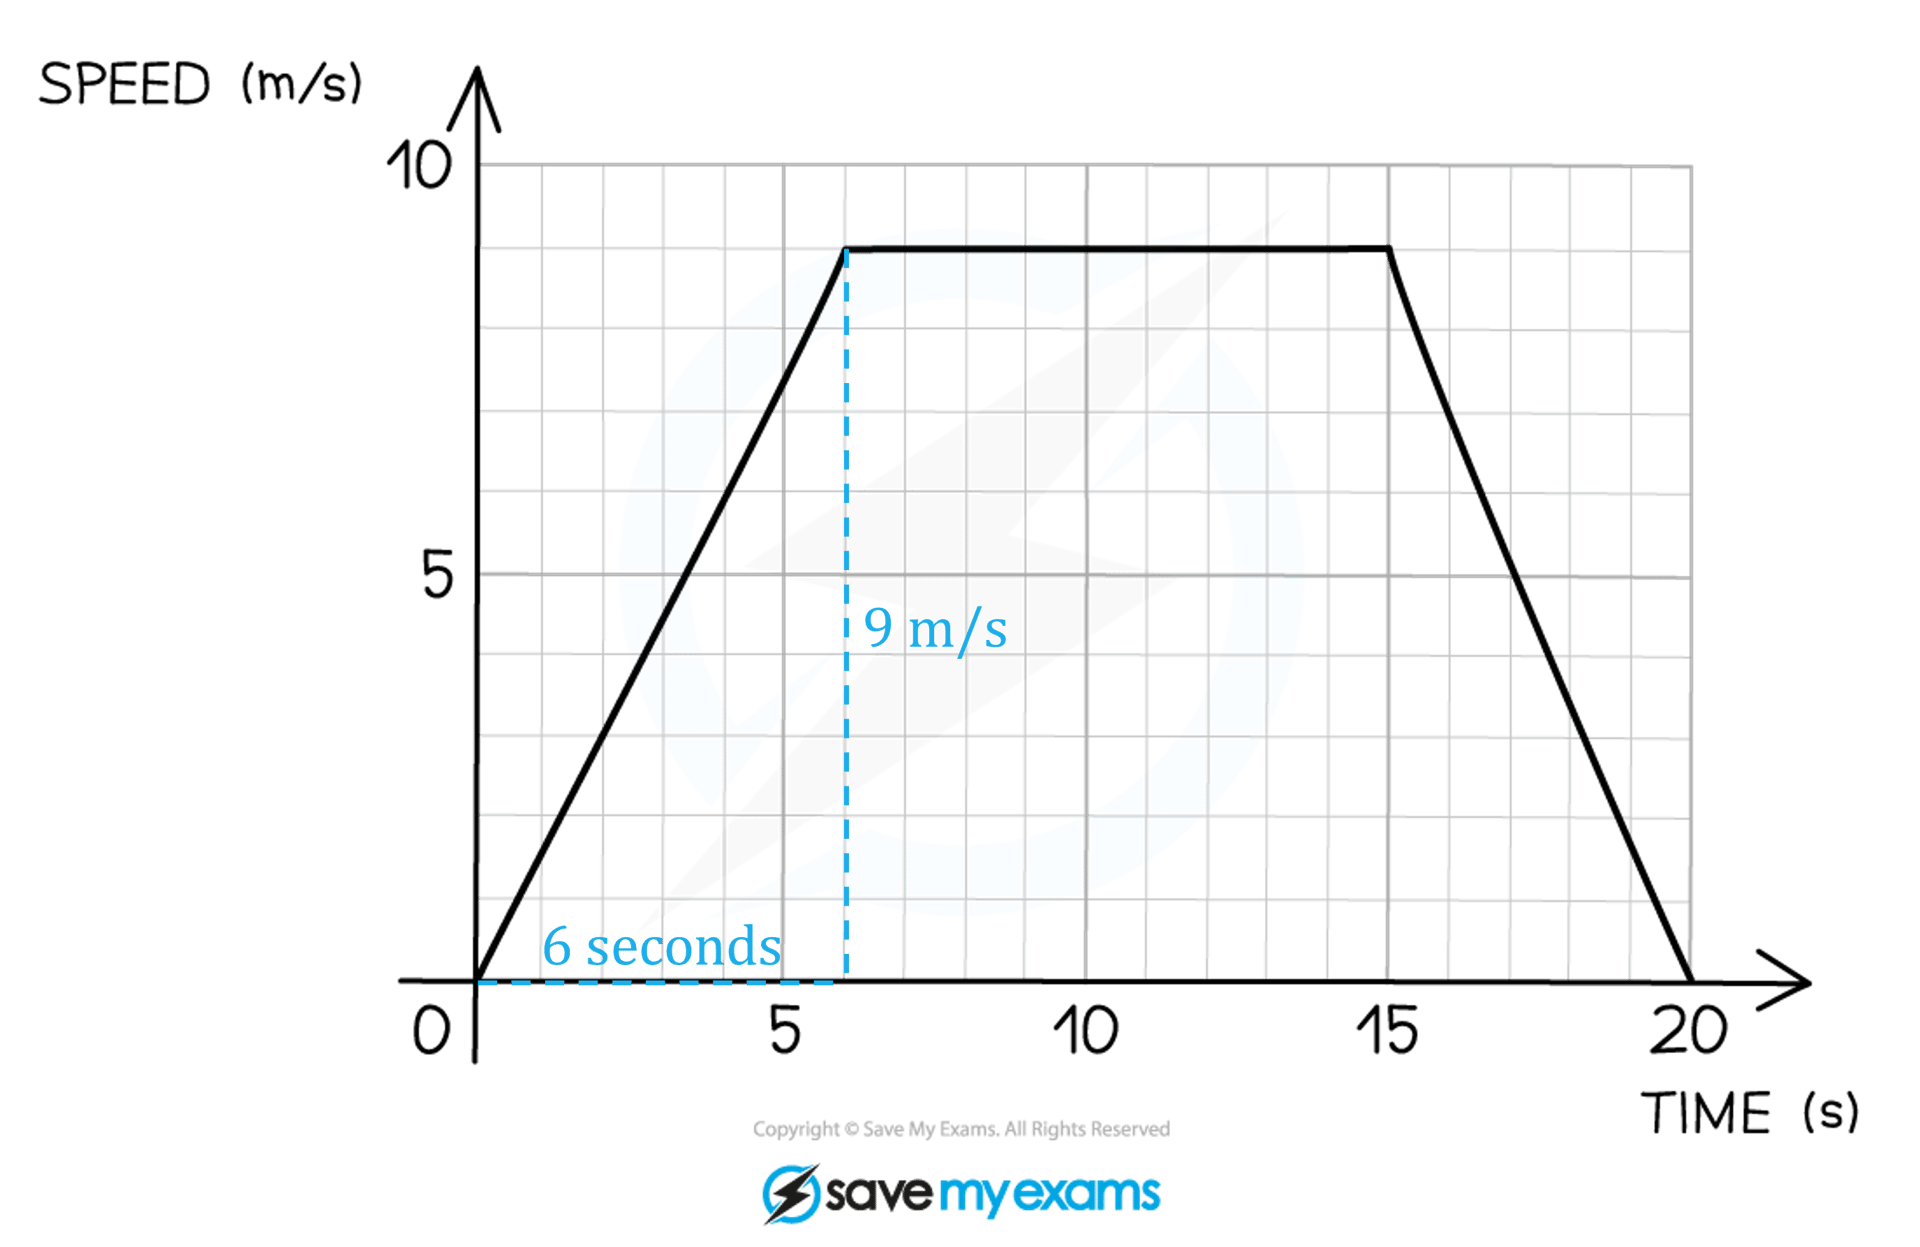
The speed-time graph for a car travelling between two sets of traffic lights is shown below.

a)
Calculate the acceleration in the first 6 seconds.
In a speed-time graph the acceleration is the gradient of the graph.
format('truetype')%3Bfont-weight%3Anormal%3Bfont-style%3Anormal%3B%7D%3C%2Fstyle%3E%3C%2Fdefs%3E%3Ctext%20fill%3D%22%231BAEEB%22%20font-family%3D%22Times%20New%20Roman%22%20font-size%3D%2218%22%20text-anchor%3D%22middle%22%20x%3D%2243.5%22%20y%3D%2230%22%3Eacceleration%3C%2Ftext%3E%3Ctext%20fill%3D%22%231BAEEB%22%20font-family%3D%22math17f39f8317fbdb1988ef4c628eb%22%20font-size%3D%2216%22%20text-anchor%3D%22middle%22%20x%3D%2299.5%22%20y%3D%2230%22%3E%3D%3C%2Ftext%3E%3Cline%20stroke%3D%22%231BAEEB%22%20stroke-linecap%3D%22square%22%20stroke-width%3D%221%22%20x1%3D%22114.5%22%20x2%3D%22147.5%22%20y1%3D%2223.5%22%20y2%3D%2223.5%22%2F%3E%3Ctext%20fill%3D%22%231BAEEB%22%20font-family%3D%22Times%20New%20Roman%22%20font-size%3D%2218%22%20text-anchor%3D%22middle%22%20x%3D%22133.5%22%20y%3D%2216%22%3Erise%3C%2Ftext%3E%3Ctext%20fill%3D%22%231BAEEB%22%20font-family%3D%22Times%20New%20Roman%22%20font-size%3D%2218%22%20text-anchor%3D%22middle%22%20x%3D%22131.5%22%20y%3D%2241%22%3Erun%3C%2Ftext%3E%3Ctext%20fill%3D%22%231BAEEB%22%20font-family%3D%22math17f39f8317fbdb1988ef4c628eb%22%20font-size%3D%2216%22%20text-anchor%3D%22middle%22%20x%3D%22158.5%22%20y%3D%2230%22%3E%3D%3C%2Ftext%3E%3Cline%20stroke%3D%22%231BAEEB%22%20stroke-linecap%3D%22square%22%20stroke-width%3D%221%22%20x1%3D%22173.5%22%20x2%3D%22217.5%22%20y1%3D%2223.5%22%20y2%3D%2223.5%22%2F%3E%3Ctext%20fill%3D%22%231BAEEB%22%20font-family%3D%22Times%20New%20Roman%22%20font-size%3D%2218%22%20text-anchor%3D%22middle%22%20x%3D%22195.5%22%20y%3D%2216%22%3Espeed%3C%2Ftext%3E%3Ctext%20fill%3D%22%231BAEEB%22%20font-family%3D%22Times%20New%20Roman%22%20font-size%3D%2218%22%20text-anchor%3D%22middle%22%20x%3D%22196.5%22%20y%3D%2241%22%3Etime%3C%2Ftext%3E%3C%2Fsvg%3E)
format('truetype')%3Bfont-weight%3Anormal%3Bfont-style%3Anormal%3B%7D%3C%2Fstyle%3E%3C%2Fdefs%3E%3Ctext%20fill%3D%22%23ED4850%22%20font-family%3D%22Times%20New%20Roman%22%20font-size%3D%2218%22%20text-anchor%3D%22middle%22%20x%3D%2243.5%22%20y%3D%2230%22%3Eacceleration%3C%2Ftext%3E%3Ctext%20fill%3D%22%23ED4850%22%20font-family%3D%22math1ef857f7542828b889facc8a533%22%20font-size%3D%2216%22%20text-anchor%3D%22middle%22%20x%3D%2299.5%22%20y%3D%2230%22%3E%3D%3C%2Ftext%3E%3Cline%20stroke%3D%22%23ED4850%22%20stroke-linecap%3D%22square%22%20stroke-width%3D%221%22%20x1%3D%22114.5%22%20x2%3D%22162.5%22%20y1%3D%2223.5%22%20y2%3D%2223.5%22%2F%3E%3Ctext%20fill%3D%22%23ED4850%22%20font-family%3D%22Times%20New%20Roman%22%20font-size%3D%2218%22%20text-anchor%3D%22middle%22%20x%3D%22120.5%22%20y%3D%2216%22%3E9%3C%2Ftext%3E%3Ctext%20fill%3D%22%23ED4850%22%20font-family%3D%22Times%20New%20Roman%22%20font-size%3D%2218%22%20text-anchor%3D%22middle%22%20x%3D%22136.5%22%20y%3D%2216%22%3Em%3C%2Ftext%3E%3Ctext%20fill%3D%22%23ED4850%22%20font-family%3D%22math1ef857f7542828b889facc8a533%22%20font-size%3D%2216%22%20text-anchor%3D%22middle%22%20x%3D%22148.5%22%20y%3D%2216%22%3E%2F%3C%2Ftext%3E%3Ctext%20fill%3D%22%23ED4850%22%20font-family%3D%22Times%20New%20Roman%22%20font-size%3D%2218%22%20text-anchor%3D%22middle%22%20x%3D%22157.5%22%20y%3D%2216%22%3Es%3C%2Ftext%3E%3Ctext%20fill%3D%22%23ED4850%22%20font-family%3D%22Times%20New%20Roman%22%20font-size%3D%2218%22%20text-anchor%3D%22middle%22%20x%3D%22133.5%22%20y%3D%2241%22%3E6%3C%2Ftext%3E%3Ctext%20fill%3D%22%23ED4850%22%20font-family%3D%22Times%20New%20Roman%22%20font-size%3D%2218%22%20text-anchor%3D%22middle%22%20x%3D%22145.5%22%20y%3D%2241%22%3Es%3C%2Ftext%3E%3Ctext%20fill%3D%22%23ED4850%22%20font-family%3D%22math1ef857f7542828b889facc8a533%22%20font-size%3D%2216%22%20text-anchor%3D%22middle%22%20x%3D%22177.5%22%20y%3D%2230%22%3E%3D%3C%2Ftext%3E%3Ctext%20fill%3D%22%23ED4850%22%20font-family%3D%22Times%20New%20Roman%22%20font-size%3D%2218%22%20text-anchor%3D%22middle%22%20x%3D%22194.5%22%20y%3D%2230%22%3E1%3C%2Ftext%3E%3Ctext%20fill%3D%22%23ED4850%22%20font-family%3D%22math1ef857f7542828b889facc8a533%22%20font-size%3D%2216%22%20text-anchor%3D%22middle%22%20x%3D%22201.5%22%20y%3D%2230%22%3E.%3C%2Ftext%3E%3Ctext%20fill%3D%22%23ED4850%22%20font-family%3D%22Times%20New%20Roman%22%20font-size%3D%2218%22%20text-anchor%3D%22middle%22%20x%3D%22208.5%22%20y%3D%2230%22%3E5%3C%2Ftext%3E%3Cline%20stroke%3D%22%23ED4850%22%20stroke-linecap%3D%22square%22%20stroke-width%3D%221%22%20x1%3D%22219.5%22%20x2%3D%22254.5%22%20y1%3D%2223.5%22%20y2%3D%2223.5%22%2F%3E%3Ctext%20fill%3D%22%23ED4850%22%20font-family%3D%22Times%20New%20Roman%22%20font-size%3D%2218%22%20text-anchor%3D%22middle%22%20x%3D%22228.5%22%20y%3D%2216%22%3Em%3C%2Ftext%3E%3Ctext%20fill%3D%22%23ED4850%22%20font-family%3D%22math1ef857f7542828b889facc8a533%22%20font-size%3D%2216%22%20text-anchor%3D%22middle%22%20x%3D%22240.5%22%20y%3D%2216%22%3E%2F%3C%2Ftext%3E%3Ctext%20fill%3D%22%23ED4850%22%20font-family%3D%22Times%20New%20Roman%22%20font-size%3D%2218%22%20text-anchor%3D%22middle%22%20x%3D%22249.5%22%20y%3D%2216%22%3Es%3C%2Ftext%3E%3Ctext%20fill%3D%22%23ED4850%22%20font-family%3D%22Times%20New%20Roman%22%20font-size%3D%2218%22%20text-anchor%3D%22middle%22%20x%3D%22237.5%22%20y%3D%2241%22%3Es%3C%2Ftext%3E%3C%2Fsvg%3E)
Acceleration = 1.5 m/s2
b)
Work out the distance covered by the car.
In a speed-time graph the distance travelled is equal to the area under the graph.
The graph is a trapezium so use the formula format('truetype')%3Bfont-weight%3Anormal%3Bfont-style%3Anormal%3B%7D%40font-face%7Bfont-family%3A'round_brackets18549f92a457f2409'%3Bsrc%3Aurl(data%3Afont%2Ftruetype%3Bcharset%3Dutf-8%3Bbase64%2CAAEAAAAMAIAAAwBAT1MvMjwHLFQAAADMAAAATmNtYXDf7xCrAAABHAAAADxjdnQgBAkDLgAAAVgAAAASZ2x5ZmAOz2cAAAFsAAABJGhlYWQOKih8AAACkAAAADZoaGVhCvgVwgAAAsgAAAAkaG10eCA6AAIAAALsAAAADGxvY2EAAARLAAAC%2BAAAABBtYXhwBIgEWQAAAwgAAAAgbmFtZXHR30MAAAMoAAACOXBvc3QDogHPAAAFZAAAACBwcmVwupWEAAAABYQAAAAHAAAGcgGQAAUAAAgACAAAAAAACAAIAAAAAAAAAQIAAAAAAAAAAAAAAAAAAAAAAAAAAAAAAAAAAAAAACAgICAAAAAo8AMGe%2F57AAAHPgGyAAAAAAACAAEAAQAAABQAAwABAAAAFAAEACgAAAAGAAQAAQACACgAKf%2F%2FAAAAKAAp%2F%2F%2F%2F2f%2FZAAEAAAAAAAAAAAFUAFYBAAAsAKgDgAAyAAcAAAACAAAAKgDVA1UAAwAHAAA1MxEjEyMRM9XVq4CAKgMr%2FQAC1QABAAD%2B0AIgBtAACQBNGAGwChCwA9SwAxCwAtSwChCwBdSwBRCwANSwAxCwBzywAhCwCDwAsAoQsAPUsAMQsAfUsAoQsAXUsAoQsADUsAMQsAI8sAcQsAg8MTAREAEzABEQASMAAZCQ%2FnABkJD%2BcALQ%2FZD%2BcAGQAnACcAGQ%2FnAAAQAA%2FtACIAbQAAkATRgBsAoQsAPUsAMQsALUsAoQsAXUsAUQsADUsAMQsAc8sAIQsAg8ALAKELAD1LADELAH1LAKELAF1LAKELAA1LADELACPLAHELAIPDEwARABIwAREAEzAAIg%2FnCQAZD%2BcJABkALQ%2FZD%2BcAGQAnACcAGQ%2FnAAAQAAAAEAAPW2NYFfDzz1AAMIAP%2F%2F%2F%2F%2FVre7u%2F%2F%2F%2F%2F9Wt7u4AAP7QA7cG0AAAAAoAAgABAAAAAAABAAAHPv5OAAAXcAAA%2F%2F4DtwABAAAAAAAAAAAAAAAAAAAAAwDVAAACIAAAAiAAAAAAAAAAAAAkAAAAowAAASQAAQAAAAMACgACAAAAAAACAIAEAAAAAAAEAABNAAAAAAAAABUBAgAAAAAAAAABAD4AAAAAAAAAAAACAA4APgAAAAAAAAADAFwATAAAAAAAAAAEAD4AqAAAAAAAAAAFABYA5gAAAAAAAAAGAB8A%2FAAAAAAAAAAIABwBGwABAAAAAAABAD4AAAABAAAAAAACAA4APgABAAAAAAADAFwATAABAAAAAAAEAD4AqAABAAAAAAAFABYA5gABAAAAAAAGAB8A%2FAABAAAAAAAIABwBGwADAAEECQABAD4AAAADAAEECQACAA4APgADAAEECQADAFwATAADAAEECQAEAD4AqAADAAEECQAFABYA5gADAAEECQAGAB8A%2FAADAAEECQAIABwBGwBSAG8AdQBuAGQAIABiAHIAYQBjAGsAZQB0AHMAIAB3AGkAdABoACAAYQBzAGMAZQBuAHQAIAAxADgANQA0AFIAZQBnAHUAbABhAHIATQBhAHQAaABzACAARgBvAHIAIABNAG8AcgBlACAAUgBvAHUAbgBkACAAYgByAGEAYwBrAGUAdABzACAAdwBpAHQAaAAgAGEAcwBjAGUAbgB0ACAAMQA4ADUANABSAG8AdQBuAGQAIABiAHIAYQBjAGsAZQB0AHMAIAB3AGkAdABoACAAYQBzAGMAZQBuAHQAIAAxADgANQA0AFYAZQByAHMAaQBvAG4AIAAyAC4AMFJvdW5kX2JyYWNrZXRzX3dpdGhfYXNjZW50XzE4NTQATQBhAHQAaABzACAARgBvAHIAIABNAG8AcgBlAAAAAAMAAAAAAAADnwHPAAAAAAAAAAAAAAAAAAAAAAAAAAC5B%2F8AAY2FAA%3D%3D)format('truetype')%3Bfont-weight%3Anormal%3Bfont-style%3Anormal%3B%7D%3C%2Fstyle%3E%3C%2Fdefs%3E%3Ctext%20fill%3D%22%231BAEEB%22%20font-family%3D%22Times%20New%20Roman%22%20font-size%3D%2218%22%20text-anchor%3D%22middle%22%20x%3D%2217.5%22%20y%3D%2230%22%3EArea%3C%2Ftext%3E%3Ctext%20fill%3D%22%231BAEEB%22%20font-family%3D%22math1564b4c0e54101ac57a0cb68c16%22%20font-size%3D%2216%22%20text-anchor%3D%22middle%22%20x%3D%2247.5%22%20y%3D%2230%22%3E%3D%3C%2Ftext%3E%3Cline%20stroke%3D%22%231BAEEB%22%20stroke-linecap%3D%22square%22%20stroke-width%3D%221%22%20x1%3D%2262.5%22%20x2%3D%22131.5%22%20y1%3D%2223.5%22%20y2%3D%2223.5%22%2F%3E%3Ctext%20fill%3D%22%231BAEEB%22%20font-family%3D%22round_brackets18549f92a457f2409%22%20font-size%3D%2218%22%20text-anchor%3D%22middle%22%20x%3D%2267.5%22%20y%3D%2216%22%3E(%3C%2Ftext%3E%3Ctext%20fill%3D%22%231BAEEB%22%20font-family%3D%22round_brackets18549f92a457f2409%22%20font-size%3D%2218%22%20text-anchor%3D%22middle%22%20x%3D%22116.5%22%20y%3D%2216%22%3E)%3C%2Ftext%3E%3Ctext%20fill%3D%22%231BAEEB%22%20font-family%3D%22Times%20New%20Roman%22%20font-size%3D%2218%22%20font-style%3D%22italic%22%20text-anchor%3D%22middle%22%20x%3D%2274.5%22%20y%3D%2216%22%3Ea%3C%2Ftext%3E%3Ctext%20fill%3D%22%231BAEEB%22%20font-family%3D%22math1564b4c0e54101ac57a0cb68c16%22%20font-size%3D%2216%22%20text-anchor%3D%22middle%22%20x%3D%2291.5%22%20y%3D%2216%22%3E%2B%3C%2Ftext%3E%3Ctext%20fill%3D%22%231BAEEB%22%20font-family%3D%22Times%20New%20Roman%22%20font-size%3D%2218%22%20font-style%3D%22italic%22%20text-anchor%3D%22middle%22%20x%3D%22108.5%22%20y%3D%2216%22%3Eb%3C%2Ftext%3E%3Ctext%20fill%3D%22%231BAEEB%22%20font-family%3D%22Times%20New%20Roman%22%20font-size%3D%2218%22%20font-style%3D%22italic%22%20text-anchor%3D%22middle%22%20x%3D%22124.5%22%20y%3D%2216%22%3Eh%3C%2Ftext%3E%3Ctext%20fill%3D%22%231BAEEB%22%20font-family%3D%22Times%20New%20Roman%22%20font-size%3D%2218%22%20text-anchor%3D%22middle%22%20x%3D%2297.5%22%20y%3D%2241%22%3E2%3C%2Ftext%3E%3C%2Fsvg%3E) .
.
.format('truetype')%3Bfont-weight%3Anormal%3Bfont-style%3Anormal%3B%7D%40font-face%7Bfont-family%3A'round_brackets18549f92a457f2409'%3Bsrc%3Aurl(data%3Afont%2Ftruetype%3Bcharset%3Dutf-8%3Bbase64%2CAAEAAAAMAIAAAwBAT1MvMjwHLFQAAADMAAAATmNtYXDf7xCrAAABHAAAADxjdnQgBAkDLgAAAVgAAAASZ2x5ZmAOz2cAAAFsAAABJGhlYWQOKih8AAACkAAAADZoaGVhCvgVwgAAAsgAAAAkaG10eCA6AAIAAALsAAAADGxvY2EAAARLAAAC%2BAAAABBtYXhwBIgEWQAAAwgAAAAgbmFtZXHR30MAAAMoAAACOXBvc3QDogHPAAAFZAAAACBwcmVwupWEAAAABYQAAAAHAAAGcgGQAAUAAAgACAAAAAAACAAIAAAAAAAAAQIAAAAAAAAAAAAAAAAAAAAAAAAAAAAAAAAAAAAAACAgICAAAAAo8AMGe%2F57AAAHPgGyAAAAAAACAAEAAQAAABQAAwABAAAAFAAEACgAAAAGAAQAAQACACgAKf%2F%2FAAAAKAAp%2F%2F%2F%2F2f%2FZAAEAAAAAAAAAAAFUAFYBAAAsAKgDgAAyAAcAAAACAAAAKgDVA1UAAwAHAAA1MxEjEyMRM9XVq4CAKgMr%2FQAC1QABAAD%2B0AIgBtAACQBNGAGwChCwA9SwAxCwAtSwChCwBdSwBRCwANSwAxCwBzywAhCwCDwAsAoQsAPUsAMQsAfUsAoQsAXUsAoQsADUsAMQsAI8sAcQsAg8MTAREAEzABEQASMAAZCQ%2FnABkJD%2BcALQ%2FZD%2BcAGQAnACcAGQ%2FnAAAQAA%2FtACIAbQAAkATRgBsAoQsAPUsAMQsALUsAoQsAXUsAUQsADUsAMQsAc8sAIQsAg8ALAKELAD1LADELAH1LAKELAF1LAKELAA1LADELACPLAHELAIPDEwARABIwAREAEzAAIg%2FnCQAZD%2BcJABkALQ%2FZD%2BcAGQAnACcAGQ%2FnAAAQAAAAEAAPW2NYFfDzz1AAMIAP%2F%2F%2F%2F%2FVre7u%2F%2F%2F%2F%2F9Wt7u4AAP7QA7cG0AAAAAoAAgABAAAAAAABAAAHPv5OAAAXcAAA%2F%2F4DtwABAAAAAAAAAAAAAAAAAAAAAwDVAAACIAAAAiAAAAAAAAAAAAAkAAAAowAAASQAAQAAAAMACgACAAAAAAACAIAEAAAAAAAEAABNAAAAAAAAABUBAgAAAAAAAAABAD4AAAAAAAAAAAACAA4APgAAAAAAAAADAFwATAAAAAAAAAAEAD4AqAAAAAAAAAAFABYA5gAAAAAAAAAGAB8A%2FAAAAAAAAAAIABwBGwABAAAAAAABAD4AAAABAAAAAAACAA4APgABAAAAAAADAFwATAABAAAAAAAEAD4AqAABAAAAAAAFABYA5gABAAAAAAAGAB8A%2FAABAAAAAAAIABwBGwADAAEECQABAD4AAAADAAEECQACAA4APgADAAEECQADAFwATAADAAEECQAEAD4AqAADAAEECQAFABYA5gADAAEECQAGAB8A%2FAADAAEECQAIABwBGwBSAG8AdQBuAGQAIABiAHIAYQBjAGsAZQB0AHMAIAB3AGkAdABoACAAYQBzAGMAZQBuAHQAIAAxADgANQA0AFIAZQBnAHUAbABhAHIATQBhAHQAaABzACAARgBvAHIAIABNAG8AcgBlACAAUgBvAHUAbgBkACAAYgByAGEAYwBrAGUAdABzACAAdwBpAHQAaAAgAGEAcwBjAGUAbgB0ACAAMQA4ADUANABSAG8AdQBuAGQAIABiAHIAYQBjAGsAZQB0AHMAIAB3AGkAdABoACAAYQBzAGMAZQBuAHQAIAAxADgANQA0AFYAZQByAHMAaQBvAG4AIAAyAC4AMFJvdW5kX2JyYWNrZXRzX3dpdGhfYXNjZW50XzE4NTQATQBhAHQAaABzACAARgBvAHIAIABNAG8AcgBlAAAAAAMAAAAAAAADnwHPAAAAAAAAAAAAAAAAAAAAAAAAAAC5B%2F8AAY2FAA%3D%3D)format('truetype')%3Bfont-weight%3Anormal%3Bfont-style%3Anormal%3B%7D%3C%2Fstyle%3E%3C%2Fdefs%3E%3Ctext%20fill%3D%22%23ED4850%22%20font-family%3D%22Times%20New%20Roman%22%20font-size%3D%2218%22%20text-anchor%3D%22middle%22%20x%3D%2217.5%22%20y%3D%2230%22%3EArea%3C%2Ftext%3E%3Ctext%20fill%3D%22%23ED4850%22%20font-family%3D%22math1a9323b856f5fb69d0bf7166174%22%20font-size%3D%2216%22%20text-anchor%3D%22middle%22%20x%3D%2247.5%22%20y%3D%2230%22%3E%3D%3C%2Ftext%3E%3Cline%20stroke%3D%22%23ED4850%22%20stroke-linecap%3D%22square%22%20stroke-width%3D%221%22%20x1%3D%2262.5%22%20x2%3D%22163.5%22%20y1%3D%2223.5%22%20y2%3D%2223.5%22%2F%3E%3Ctext%20fill%3D%22%23ED4850%22%20font-family%3D%22round_brackets18549f92a457f2409%22%20font-size%3D%2218%22%20text-anchor%3D%22middle%22%20x%3D%2267.5%22%20y%3D%2216%22%3E(%3C%2Ftext%3E%3Ctext%20fill%3D%22%23ED4850%22%20font-family%3D%22round_brackets18549f92a457f2409%22%20font-size%3D%2218%22%20text-anchor%3D%22middle%22%20x%3D%22124.5%22%20y%3D%2216%22%3E)%3C%2Ftext%3E%3Ctext%20fill%3D%22%23ED4850%22%20font-family%3D%22Times%20New%20Roman%22%20font-size%3D%2218%22%20text-anchor%3D%22middle%22%20x%3D%2274.5%22%20y%3D%2216%22%3E9%3C%2Ftext%3E%3Ctext%20fill%3D%22%23ED4850%22%20font-family%3D%22math1a9323b856f5fb69d0bf7166174%22%20font-size%3D%2216%22%20text-anchor%3D%22middle%22%20x%3D%2291.5%22%20y%3D%2216%22%3E%2B%3C%2Ftext%3E%3Ctext%20fill%3D%22%23ED4850%22%20font-family%3D%22Times%20New%20Roman%22%20font-size%3D%2218%22%20text-anchor%3D%22middle%22%20x%3D%22113.5%22%20y%3D%2216%22%3E20%3C%2Ftext%3E%3Ctext%20fill%3D%22%23ED4850%22%20font-family%3D%22math1a9323b856f5fb69d0bf7166174%22%20font-size%3D%2216%22%20text-anchor%3D%22middle%22%20x%3D%22140.5%22%20y%3D%2216%22%3E%26%23xD7%3B%3C%2Ftext%3E%3Ctext%20fill%3D%22%23ED4850%22%20font-family%3D%22Times%20New%20Roman%22%20font-size%3D%2218%22%20text-anchor%3D%22middle%22%20x%3D%22157.5%22%20y%3D%2216%22%3E9%3C%2Ftext%3E%3Ctext%20fill%3D%22%23ED4850%22%20font-family%3D%22Times%20New%20Roman%22%20font-size%3D%2218%22%20text-anchor%3D%22middle%22%20x%3D%22113.5%22%20y%3D%2241%22%3E2%3C%2Ftext%3E%3Ctext%20fill%3D%22%23ED4850%22%20font-family%3D%22math1a9323b856f5fb69d0bf7166174%22%20font-size%3D%2216%22%20text-anchor%3D%22middle%22%20x%3D%22178.5%22%20y%3D%2230%22%3E%3D%3C%2Ftext%3E%3Cline%20stroke%3D%22%23ED4850%22%20stroke-linecap%3D%22square%22%20stroke-width%3D%221%22%20x1%3D%22193.5%22%20x2%3D%22223.5%22%20y1%3D%2223.5%22%20y2%3D%2223.5%22%2F%3E%3Ctext%20fill%3D%22%23ED4850%22%20font-family%3D%22Times%20New%20Roman%22%20font-size%3D%2218%22%20text-anchor%3D%22middle%22%20x%3D%22208.5%22%20y%3D%2216%22%3E261%3C%2Ftext%3E%3Ctext%20fill%3D%22%23ED4850%22%20font-family%3D%22Times%20New%20Roman%22%20font-size%3D%2218%22%20text-anchor%3D%22middle%22%20x%3D%22208.5%22%20y%3D%2241%22%3E2%3C%2Ftext%3E%3Ctext%20fill%3D%22%23ED4850%22%20font-family%3D%22math1a9323b856f5fb69d0bf7166174%22%20font-size%3D%2216%22%20text-anchor%3D%22middle%22%20x%3D%22238.5%22%20y%3D%2230%22%3E%3D%3C%2Ftext%3E%3Ctext%20fill%3D%22%23ED4850%22%20font-family%3D%22Times%20New%20Roman%22%20font-size%3D%2218%22%20text-anchor%3D%22middle%22%20x%3D%22264.5%22%20y%3D%2230%22%3E130%3C%2Ftext%3E%3Ctext%20fill%3D%22%23ED4850%22%20font-family%3D%22math1a9323b856f5fb69d0bf7166174%22%20font-size%3D%2216%22%20text-anchor%3D%22middle%22%20x%3D%22280.5%22%20y%3D%2230%22%3E.%3C%2Ftext%3E%3Ctext%20fill%3D%22%23ED4850%22%20font-family%3D%22Times%20New%20Roman%22%20font-size%3D%2218%22%20text-anchor%3D%22middle%22%20x%3D%22287.5%22%20y%3D%2230%22%3E5%3C%2Ftext%3E%3C%2Fsvg%3E)
Distance travelled = 130.5 m

You've read 0 of your 0 free revision notes
Get unlimited access
to absolutely everything:
- Downloadable PDFs
- Unlimited Revision Notes
- Topic Questions
- Past Papers
- Model Answers
- Videos (Maths and Science)
Did this page help you?