4.12.2 Hypothesis Testing for Mean (Two Sample)
Two-Sample Tests
What is a two-sample test?
- A two-sample test is used to compare the means (μ1 & μ2) of two normally distributed populations
- You use a z-test when the population variances (
 &
&  ) are known
 - You use a t-test when the population variances are unknown
- In this course you will assume the variances are equal and use a pooled sample for a t-test
- In a pooled sample the data from both samples are used to estimate the population variance
What are the steps for performing a two-sample test on my GDC?
- STEP 1: Write the hypotheses
- H0 : μ1= μ2
- Clearly state that μ1 & μ2 represent the population means
- Make sure you make it clear which mean corresponds to which population
- In words this means that the two population means are equal
- For a one-tailed test H1 : μ1 < μ2 or H1 : μ1 > μ2
- For a two-tailed test: H1 : μ1 ≠ μ2
- The alternative hypothesis will depend on what is being tested
- STEP 2: Decide if it is a z-test or a t-test
- If the populations variances are known then use a z-test
- If the populations variances are unknown then use a t-test
- Assume the variances are equal and use a pooled sample
- STEP 3: Enter the data into your GDC and choose two-sample z-test or two-sample t-test
- If you have the raw data
- Enter the data as a list
- Enter the values of σ1 & σ2 if a z-test
- Choose the pooled option if a t-test
- If you have summary statistics (only for a z-test)
- Enter the values of
format('truetype')%3Bfont-weight%3Anormal%3Bfont-style%3Anormal%3B%7D%3C%2Fstyle%3E%3C%2Fdefs%3E%3Ctext%20font-family%3D%22horizontalbf65417dcecc7f2b0006e%22%20font-size%3D%2213%22%20text-anchor%3D%22middle%22%20x%3D%223.5%22%20y%3D%2210%22%3E%26%23x23AF%3B%3C%2Ftext%3E%3Ctext%20font-family%3D%22horizontalbf65417dcecc7f2b0006e%22%20font-size%3D%2213%22%20text-anchor%3D%22middle%22%20x%3D%227.5%22%20y%3D%2210%22%3E%26%23x23AF%3B%3C%2Ftext%3E%3Ctext%20font-family%3D%22Times%20New%20Roman%22%20font-size%3D%2218%22%20font-style%3D%22italic%22%20text-anchor%3D%22middle%22%20x%3D%224.5%22%20y%3D%2218%22%3Ex%3C%2Ftext%3E%3Ctext%20font-family%3D%22Times%20New%20Roman%22%20font-size%3D%2213%22%20text-anchor%3D%22middle%22%20x%3D%2213.5%22%20y%3D%2226%22%3E1%3C%2Ftext%3E%3C%2Fsvg%3E) ,
, format('truetype')%3Bfont-weight%3Anormal%3Bfont-style%3Anormal%3B%7D%3C%2Fstyle%3E%3C%2Fdefs%3E%3Ctext%20font-family%3D%22horizontalbf65417dcecc7f2b0006e%22%20font-size%3D%2213%22%20text-anchor%3D%22middle%22%20x%3D%223.5%22%20y%3D%2210%22%3E%26%23x23AF%3B%3C%2Ftext%3E%3Ctext%20font-family%3D%22horizontalbf65417dcecc7f2b0006e%22%20font-size%3D%2213%22%20text-anchor%3D%22middle%22%20x%3D%227.5%22%20y%3D%2210%22%3E%26%23x23AF%3B%3C%2Ftext%3E%3Ctext%20font-family%3D%22Times%20New%20Roman%22%20font-size%3D%2218%22%20font-style%3D%22italic%22%20text-anchor%3D%22middle%22%20x%3D%224.5%22%20y%3D%2218%22%3Ex%3C%2Ftext%3E%3Ctext%20font-family%3D%22Times%20New%20Roman%22%20font-size%3D%2213%22%20text-anchor%3D%22middle%22%20x%3D%2213.5%22%20y%3D%2226%22%3E2%3C%2Ftext%3E%3C%2Fsvg%3E) , σ1, σ2, n1 & n2
, σ1, σ2, n1 & n2 - Your GDC will give you the p-value
- STEP 4: Decide whether there is evidence to reject the null hypothesis
- If the p-value < significance level then reject H0
- STEP 5: Write your conclusion
- If you reject H0 then there is evidence to suggest that...
- The mean of the 1st population is smaller (for H1 : μ1 < μ2)
- The mean of the 1st population is bigger (for H1 : μ1 > μ2)
- The means of the two populations are different (for H1 : μ1 ≠ μ2)
- If you accept H0 then there is insufficient evidence to reject the null hypothesis which suggests that...
- The mean of the 1st population is not smaller (for H1 : μ1 < μ2)
- The mean of the 1st population is not bigger (for H1 : μ1 > μ2)
- The means of the two populations are not different (for H1 : μ1 ≠ μ2)
Worked example
The times (in minutes) for children and adults to complete a puzzle are recorded below.
|
Children |
3.1 |
2.7 |
3.5 |
3.1 |
2.9 |
3.2 |
3.0 |
2.9 |
|
|
|
Adults |
3.1 |
3.6 |
3.5 |
3.6 |
2.9 |
3.6 |
3.4 |
3.6 |
3.7 |
3.0 |
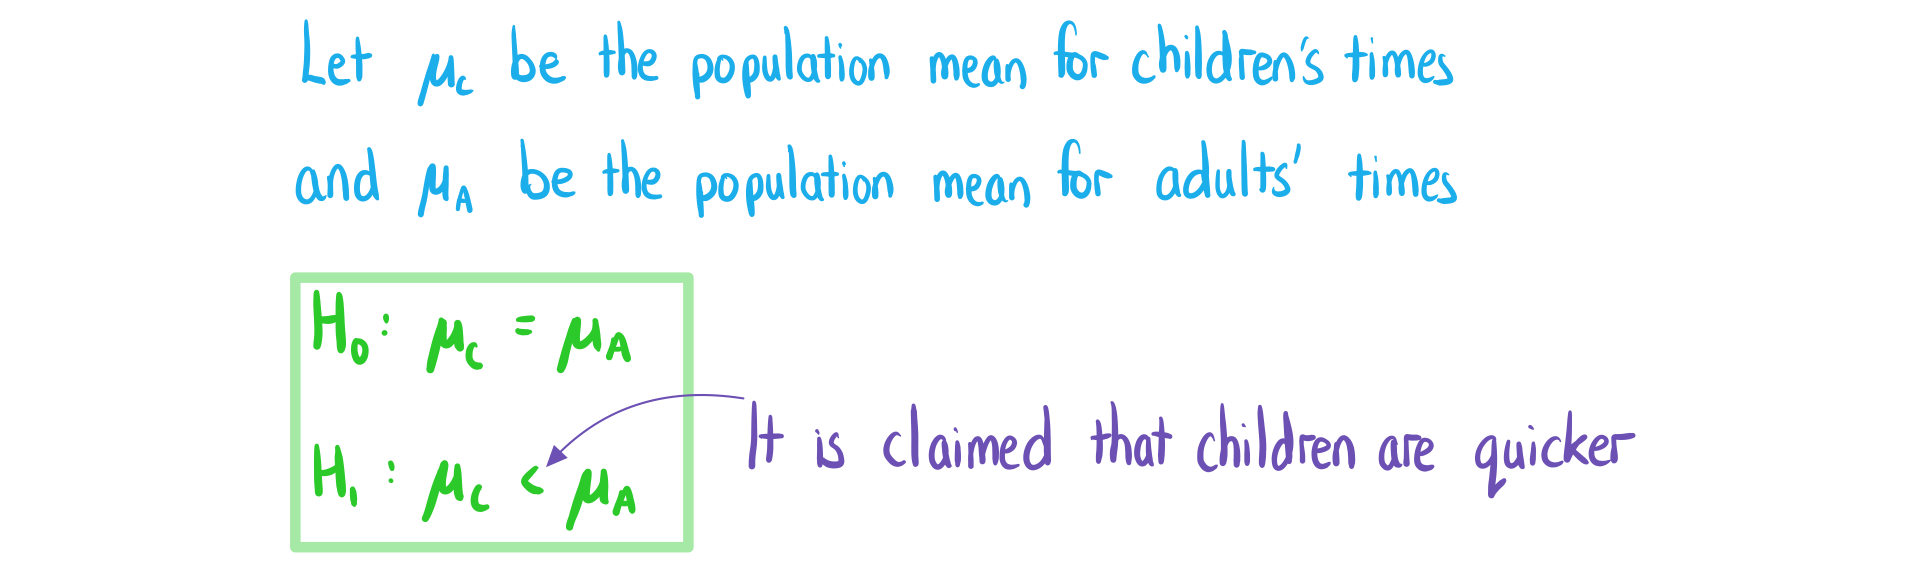
The creator of the puzzle claims children are generally faster at solving the puzzle than adults. A t-test is to be performed at a 1% significance level.
a)
Write down the null and alternative hypotheses.
b)
Find the p-value for this test.

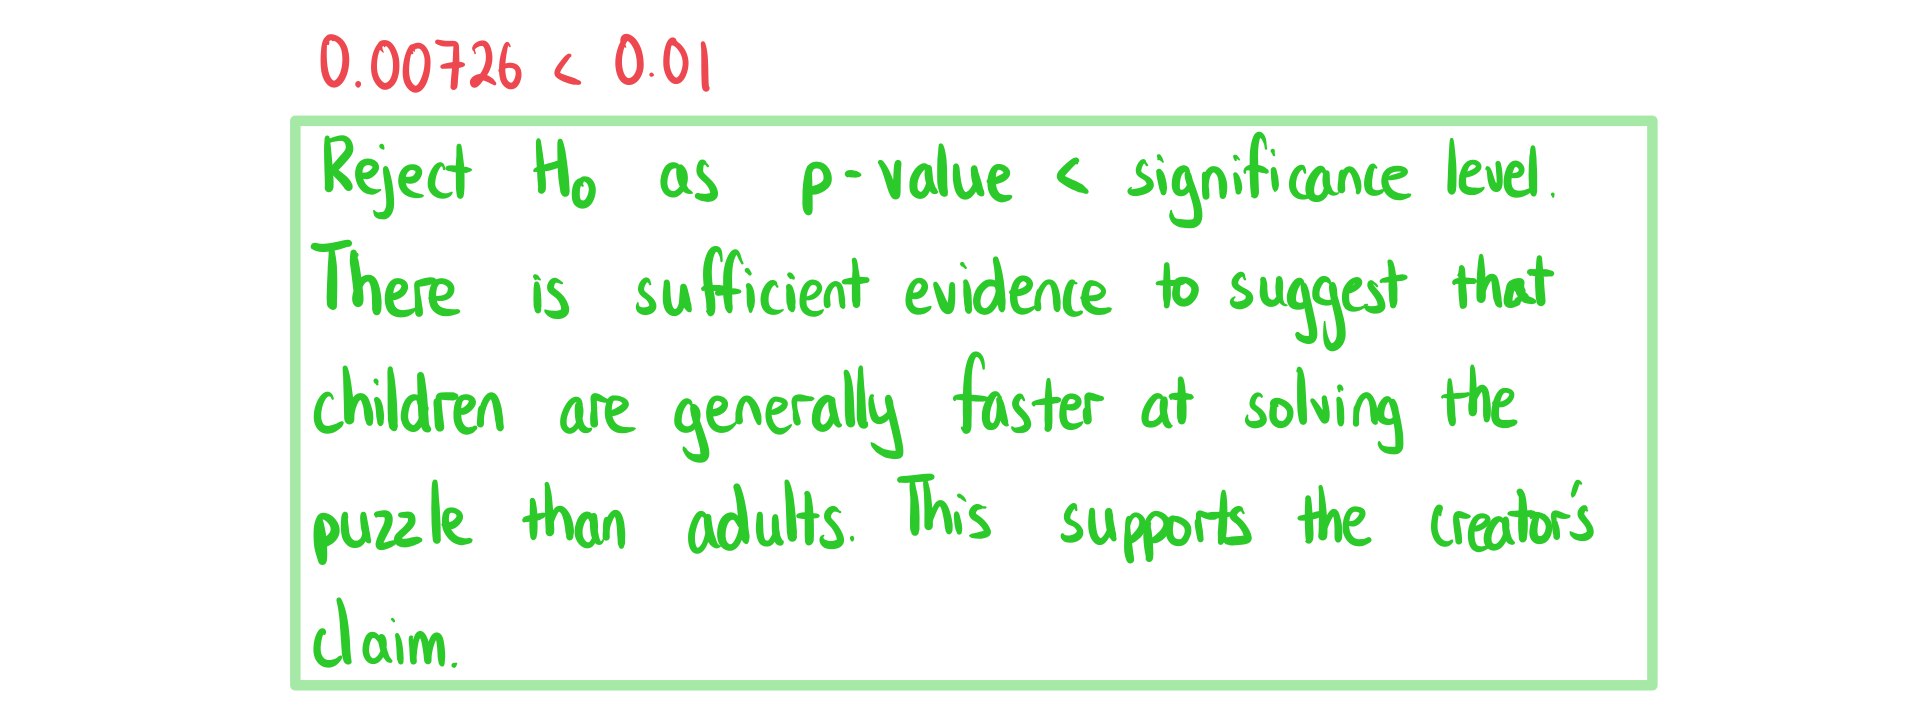
c)
State whether the creator’s claim is supported by the test. Give a reason for your answer.
Paired t-tests
What is a paired t-test?
- A paired test is where you take two samples but each data point from one sample can be paired with a data point from the other sample
- These are used when one group of members are used twice and the two results for each member are paired
- It could be to compare the sample before and after introducing a new factor
- It could be to compare the sample under two different conditions
- For this test you use the differences between the pairs and treat them as one sample
- As the variance of the differences is unlikely to be known you will use a t-test
- For a paired test you need to assume the differences are normally distributed
- You don’t need to assume the populations are normally distributed
What are the steps for performing a paired t-test on my GDC?
- STEP 1: Write the hypotheses
- H0 : μD = 0
- Clearly state that μD represents the population mean of the differences
- In words this means the population mean has not changed
- For a one-tailed test H1 : μD < 0 or H1 : μD > 0
- For a two-tailed test: H1 : μD ≠ 0
- The alternative hypothesis will depend on what is being tested
- STEP 2: Enter the data into your GDC and choose the one-sample t-test
- Enter the differences as a list
- Be consistent with the order in which you subtract paired values
- Your GDC will give you the p-value
- STEP 3: Decide whether there is evidence to reject the null hypothesis
- If the p-value < significance level then reject H0
- STEP 4: Write your conclusion
- If you reject H0 then there is evidence to suggest that...
- The mean has decreased (for H1 : μD < 0)
- The mean has increased (for H1 : μD > 0)
- The mean has changed (for H1 : μD ≠ 0)
- If you accept H0 then there is insufficient evidence to reject the null which suggests that...
- The mean has not decreased (for H1 : μD < 0)
- The mean has not increased (for H1 : μD > 0)
- The mean has not changed (for H1 : μD ≠ 0)
Exam Tip
- If an exam question has two samples with the same number of members then consider carefully whether it makes sense to do a paired test or a two sample test
- The examiner might make it look like it is a paired test to trick you!
Worked example
In a school all students must study French and Spanish. 9 students are selected and complete a test in both subjects, the standardised scores are shown below
|
Student |
1 |
2 |
3 |
4 |
5 |
6 |
7 |
8 |
9 |
|
French score |
61 |
82 |
77 |
80 |
99 |
69 |
75 |
71 |
81 |
|
Spanish score |
74 |
79 |
83 |
66 |
95 |
79 |
82 |
81 |
85 |
The headteacher wants to investigate whether there is a difference in the students’ scores between the two subjects. A paired t-test is to be performed at a 10% significance level.
a)
Write down the null and alternative hypotheses.

b)
Find the p-value for this test.

c)
Write down the conclusion to the test. Give a reason for your answer.


You've read 0 of your 0 free revision notes
Get unlimited access
to absolutely everything:
- Downloadable PDFs
- Unlimited Revision Notes
- Topic Questions
- Past Papers
- Model Answers
- Videos (Maths and Science)
Did this page help you?
