DP IB Biology: SL

Topic Questions

Syllabus Edition

First teaching 2014

Last exams 2024

|

1.3 Cells: Membrane Structure & Transport

1a
Sme Calculator
2 marks

Define the following terms:

(i)
hydrophilic
[1]
(ii)
hydrophobic

[1]

1b
Sme Calculator
2 marks

Draw a labelled diagram of a phospholipid molecule.

1c
Sme Calculator
1 mark

State the property of phospholipids that causes them to form bilayers when placed in water.

1d
Sme Calculator
2 marks

State the functions of cholesterol in animal membranes.

Did this page help you?

2a
Sme Calculator
3 marks

Define active transport. 

2b
Sme Calculator
3 marks

List three factors that affect the rate of diffusion of substances across a membrane.

2c
Sme Calculator
1 mark

State the name of the process by which materials are transported from structures S to R in the diagram below.

1-3-e-2c-paper-2

2d
Sme Calculator
1 mark

Name one material that could be transported from structure S to R.

Did this page help you?

3a
Sme Calculator
2 marks

The below diagram shows the plasma membrane of an Amoeba sp and some molecules of a small, nonpolar substance known as substance X.

1-3-e-3a-paper-2

State:

(i)
the direction substance X would move
[1]
(ii)
the process by which substance X would move

.[1]

3b
Sme Calculator
2 marks

List two possible examples of substance X.

3c
Sme Calculator
2 marks

Amoeba requires potassium ions to assist with detecting prey.

Outline how these ions would be transported across the membrane shown in part (a).

3d
Sme Calculator
1 mark

To feed upon bacteria, Amoeba uses pseudopodia to engulf the bacteria.

State the process used to engulf the bacteria.

Did this page help you?

4a
Sme Calculator
4 marks

Label the diagram below.1-3-e-4a-paper-2

4b
Sme Calculator
2 marks

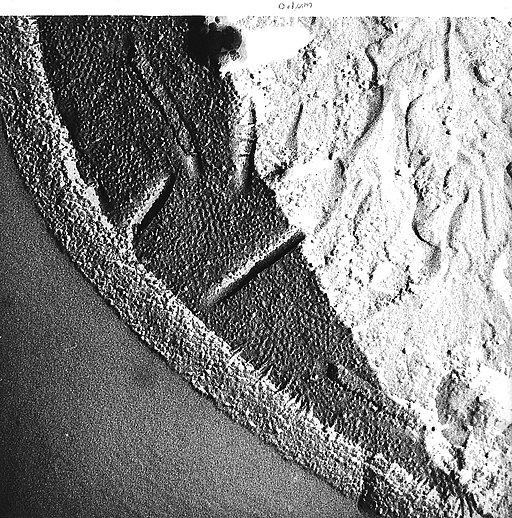
The electron micrograph below shows part of a yeast cell’s membrane and cytoplasm. 

Bakers yeast wall-membrane-cytoplasm

Tgru001, CC0, via Wikimedia Commons

Outline how micrographs like this were used as evidence to falsify the Davson-Danielli model.

4c
Sme Calculator
3 marks

During class, a group of students investigating the impact of different salt concentrations on the mass of celery, collected the results into the table below.

Concentration of salt / mol dm-3

Initial mass / g

Final mass / g

Mass change / g

Mass change / % 

0.0

12.2

14.5

+ 2.3

+ 18.9

0.2

10.0

11.7

+ 1.7

+ 17.0

0.4

9.6

9.3

- 0.3

- 3.1

0.6

11.3

10.5

- 0.8


0.8

12.5

11.2

- 1.3

- 10.4

1.0

10.7

8.5

- 2.2

- 20.6


(i)

Calculate the percentage change in mass for 0.6 mol dm-3

[1]

(ii)
Estimate, with a reason, the osmolarity of the celery tissue

[2]

4d
Sme Calculator
2 marks

The diagram below is a student's drawing of three celery cells seen under a light microscope at the end of the investigation from part (c).1-3-e-4d-paper-2


Deduce, with a reason, which salt concentration/s these cells have been immersed in.

Did this page help you?

5a
Sme Calculator
5 marks

One mark is available for clarity of communication throughout this question.

Outline the functions of five different membrane proteins.

5b
Sme Calculator
4 marks

Distinguish between the following two models of the plasma membrane:

Davson-Danielli and Singer-Nicolson.

5c
Sme Calculator
6 marks

Compare the passive transport of substances across membranes, using named examples.

Did this page help you?

1a
Sme Calculator
2 marks

The concentration of sodium ions in red blood cells is lower than the concentration in blood plasma.

Explain how this difference in sodium concentration is maintained.

1b
Sme Calculator
2 marks

During pregnancy, the fetus is dependent on essential proteins being absorbed from the mother’s blood in the placenta.

Explain how these proteins would be transported into the fetus.

1c
Sme Calculator
3 marks

Describe how the structure of the membrane allows for the transport of proteins from the mother to the fetus.

1d
Sme Calculator
3 marks

Discuss the evidence used to falsify the Davson-Danielli model of membrane structure.

Did this page help you?

2a
Sme Calculator
1 mark

Identify the part of the fluid mosaic structure of the plasma membrane represented by the molecular diagram below.

1-3-h-2a-paper-2

2b
Sme Calculator
3 marks

Scientists have found that wheat crops adapted to grow in winter have increased unsaturated phospholipid content.

Suggest why the presence of unsaturated phospholipids would be advantageous.

2c
Sme Calculator
2 marks

Pieces of phospholipid bilayer were analysed from two different mammalian cell surface membranes. Sample X contained phospholipid molecules at a density of 4.2 x 10⁶ molecules µm-2, whereas sample Y contained phospholipid molecules at a density of 5.5 x 10⁶ molecules µm-2. One sample was from an exocrine pancreatic cell and the other was from a skin cell.

Identify, with reasons, which cell type corresponds to samples X and Y.  

2d
Sme Calculator
2 marks

Researchers have discovered that an individual phospholipid molecule can exchange places with its neighbouring phospholipid molecule in a monolayer as frequently as 107 times per second. By contrast, phospholipid molecules almost never exchange places with each other from one monolayer to the other within a bilayer, referred to as a ‘flip-flop’ exchange. The ‘flip-flop’ takes place around once a month for a typical phospholipid molecule.

Suggest why there is this difference in molecular behaviour.

Did this page help you?

3a
Sme Calculator
2 marks

Outline why scientists use detergents to study the structure of membranes. 

3b
Sme Calculator
2 marks

Diffusion can be studied using visking tubing. Students set up an investigation in which equal volumes of each of the following solutions were placed into separate visking tubings:

0.7 mol dm-3 sodium chloride

0.7 mol dm-3 glucose

The visking tubings, each of the same size, were placed in distilled water and maintained at a constant temperature of 23°C. The volume and mass of the bags were measured at 5 minute intervals for 160 minutes.

The data recorded is shown below.

1-3-h-3b-paper-2

Calculate the rates of increase in mass and in volume for the visking tubing containing glucose solution during the first 30 minutes.

3c
Sme Calculator
3 marks

Compare and contrast the rates of change in mass for the two visking tubings.

3d
Sme Calculator
2 marks

Explain why the volume of both visking tubings increases over time.

Did this page help you?

4a
Sme Calculator
1 mark

A biologist investigated the osmolarity of different parts of turnip tubers of different ages (as shown in the diagram below). The osmolarity was estimated using discs of turnip tissue and sucrose solutions of different concentrations.
The diagram below shows:

The appearance of the tubers

The places where the tissues were removed

1-3-h-4a-paper-2

The results are shown in the graph below1-3-h-4a2-paper-2

Estimate the osmolarity of the near new shoot sample of the old tuber.

4b
Sme Calculator
2 marks

Explain why the biologist used percentage change in mass rather than the change in actual mass.

4c
Sme Calculator
3 marks

After analysing the data the biologist came to the following conclusions:

  1. The tissue in the old tuber close to the new shoots has the highest osmolarity
  2. In the old tuber close to new shoots, starch reserves were being converted to sugar
  3. In the old tuber central region, starch was being converted to sugar
  4. In the newly formed tuber, all the sugar had been converted to starch.

Evaluate the conclusions made by the biologist based on the evidence collected.

4d
Sme Calculator
2 marks

Suggest two possible sources of error that the biologist may have encountered when collecting the data in this investigation.

Did this page help you?

5a
Sme Calculator
3 marks

One mark is available for clarity of communication throughout this question.

Explain the consequences to impulse transmission if mammalian neurons were to stop performing facilitated diffusion of potassium ions.

5b
Sme Calculator
4 marks

Outline the effects of putting human heart tissue into a hypotonic solution.

5c
Sme Calculator
7 marks

Draw a labelled diagram to show the structure of the fluid mosaic structure containing four different named proteins. 

Did this page help you?

1a1 mark

Phospholipids are described as amphipathic molecules. Explain what this means.

1b2 marks

Liposomes can be used in a range of applications such as the delivery of mRNA vaccines to specific areas of the body.

Sketch a small section of the structure of a liposome indicating its exterior, interior and the hydrophobic and hydrophilic regions.

1c2 marks

Describe the properties that allow some molecules to diffuse rapidly across the cell membrane.

1d4 marks

The diagram below shows a typical epithelial cell that lines the airways of the lungs. The viscosity of mucus is controlled by the CFTR chloride ion channel. When there is too little water in the mucus the CFTR channel opens allowing Cl- ions to move into the mucus. When active, the CFTR channel also inhibits the sodium channel and limits movement of Na+ ions into the cell. The resulting high concentration of salt in the mucus draws water out of the cell via osmosis which makes the mucus less viscous. q1d-1-3-cells-membrane-medium-ib-hl-biology-sq

Cystic fibrosis is a genetic disorder characterised by the build-up of thick sticky mucus that causes severe damage to the respiratory and digestive systems. People with class I cystic fibrosis have inherited two faulty versions of the gene for CFTR which results in an absence of the CFTR channel.

(i)
Suggest how having no CFTR channel impacts the movement of Na+ and Cl- ions across epithelial cells.

(ii)
Describe why the mucus of cystic fibrosis sufferers is thick and sticky.

Did this page help you?

2a1 mark

Cubes of potato were placed in a solution containing sodium ions. The concentration of oxygen in air bubbled through the solution was changed and the rates of respiration and uptake of sodium ions were measured. The results are shown in the table below.

Concentration of oxygen / % Rate of respiration / arbitrary units Rate of uptake of sodium ions / arbitrary units
3.8 43 54
15.6 56 76
24.7 62 87
32.9 89 90

Describe the relationship between oxygen concentration, rate of respiration and rate of uptake of sodium ions.

2b2 marks

Suggest reasons for the relationship between oxygen concentration, rate of respiration and rate of uptake of sodium ions described in part (a).

2c2 marks

Give two similarities between the processes by which inorganic ions and water molecules enter cells.

2d3 marks

Distinguish between passive and active movement of molecules across the cell membrane.

Passive Active


Did this page help you?

3a2 marks

Some scientists investigated the uptake of magnesium ions in rice plants. They divided the plants into two groups and placed their roots in solutions containing radioactive magnesium ions.

Group Y: plants had a substance that inhibited respiration added to the solution

Group Z: plants did not have the respiratory inhibitor added to the solution

The scientists calculated the total mass of magnesium ions absorbed by the plants every 5 minutes. Their results are shown in the graph below:q3a-1-3-cells-membrane-medium-ib-hl-biology-sq

Calculate the ratio of the mean rate of uptake of magnesium ions in the first 20 minutes to the mean rate of uptake of magnesium ions in the second 20 minutes for group Z plants.

3b2 marks

Using the graph in part (a), calculate the rate of uptake of magnesium ions for group Y plants after 40 minutes. Give suitable units.

3c3 marks

Consider the graph in part (a). Explain the results of the investigation.

3d2 marks

State two differences between the processes of facilitated diffusion and active transport.

Did this page help you?

4a2 marks

A biologist investigated how surface area affects osmosis in potato cubes.

Step 1:  Cut two cubes of potato, each with sides of 4 cm in length.
Step 2:  Place one cube into concentrated (40%) sucrose solution.
Step 3:  Cut the remaining cube into eight equal-sized smaller cubes and place into concentrated (40%) sucrose solution.
Step 4:  Record the masses of the cubes at time intervals.

The results are shown in the graphq4a-1-3-cells-membrane-medium-ib-hl-biology-sq

Explain why the potato tissue changed in mass.

4b2 marks

The biologist recorded the masses of the cubes at intervals. Before weighing the cubes at each interval, the biologist blotted dry the outside of each cube. Explain why.

4c4 marks

During the first 20 minutes, the combined loss in mass of the eight small cubes is greater than in the single large cube (as shown in the graph in part a). Calculate the rate of loss in mass per cm2 per minute for the single large cube and the eight small cubes during the first 20 minutes. Give your answers in grams per cm2 per minute and show your working.

Did this page help you?

5a4 marks

One mark is available for clarity of communication throughout this question.

The drawing below shows an electron micrograph of a neuron. Similar images helped support the Davson and Danielli model of membrane structure.q5a-1-3-cells-membrane-medium-ib-hl-biology-sq

(i)
Describe the Davson and Danielli model of membrane structure.

(ii)
Explain how the structure labeled X was misinterpreted.
5b4 marks

 Outline the evidence that led to the Davson and Danielli model being rejected.

5c7 marks

Draw an annotated diagram of the cell membrane based on the fluid mosaic model including all the relevant structures.

Did this page help you?