AQA AS Physics

Revision Notes

4.3.1 Motion Along a Straight Line

Test Yourself

Displacement, Speed, Velocity & Acceleration

Scalar quantities

  • Scalar quantities only have a magnitude (size)
    • Distance: the total length between two points
    • Speed: the total distance travelled per unit of time

Vector quantities

  • Vector quantities have both magnitude and direction
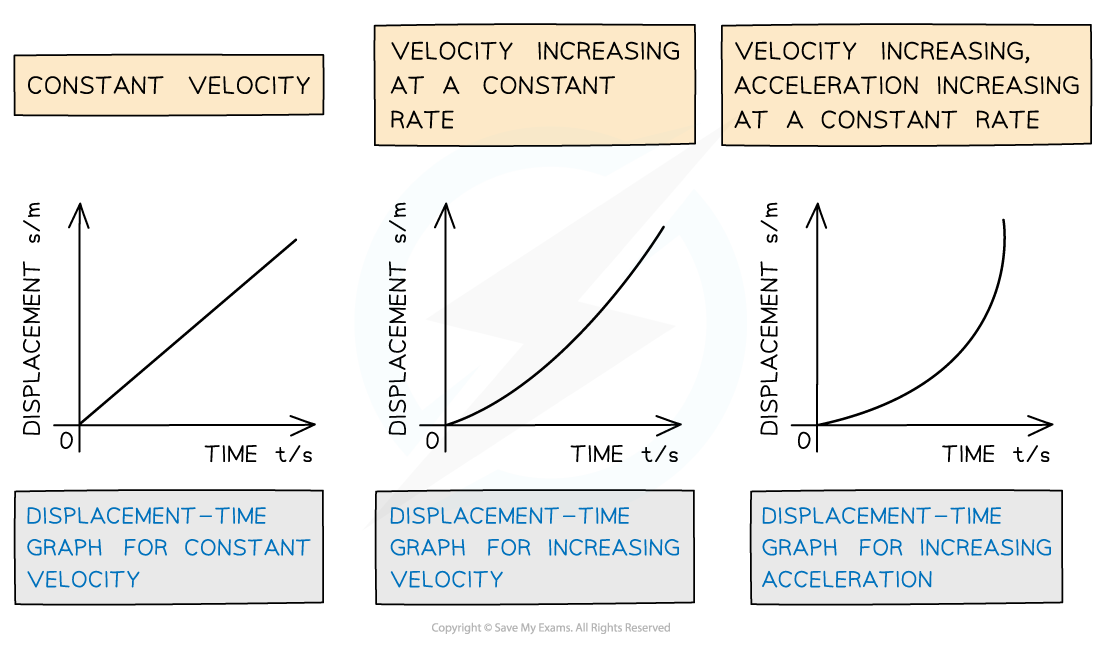
    • Displacement: the distance of an object from a fixed point in a specified direction
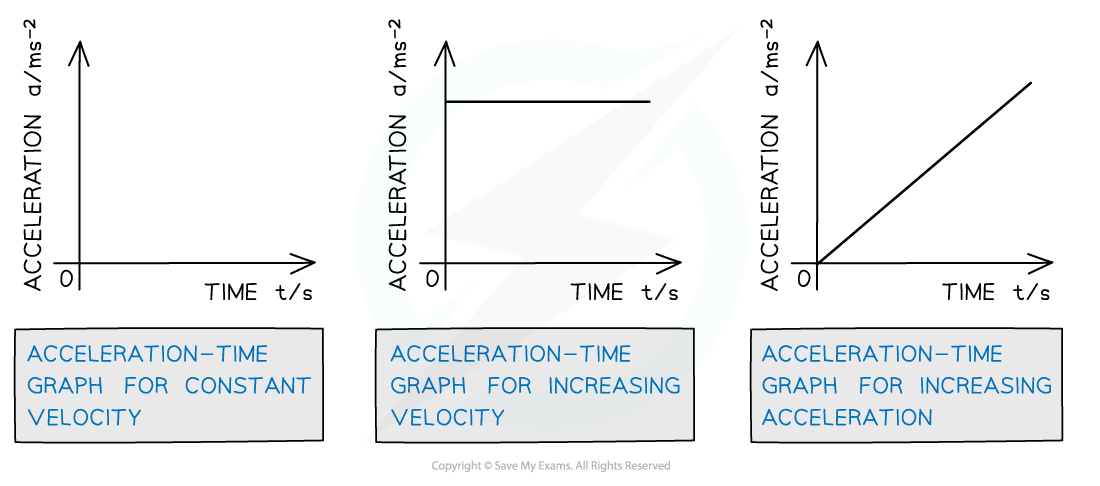
    • Velocity: the rate of change of displacement of an object
    • Acceleration: the rate of change of velocity of an object

Equations for Velocity & Acceleration

Equation Definitions, downloadable AS & A Level Physics revision notes

Equations linking displacement, velocity and acceleration

Worked example

A car accelerates uniformly from rest to a speed of 150 km h–1 in 6.2 s.Calculate the magnitude of the acceleration of the car in m s–2.

Acceleration Worked Example

Average & Instantaneous Speed

Instantaneous Speed / Velocity

  • The instantaneous speed (or velocity) is the speed (or velocity) of an object at any given point in time
  • This could be for an object moving at a constant velocity or accelerating
    • An object accelerating is shown by a curved line on a displacement – time graph
    • An accelerating object will have a changing velocity

  • To find the instantaneous velocity on a displacement-time graph:
    • Draw a tangent at the required time
    • Calculate the gradient of that tangent

Instantaneous velocity on s-t graph, downloadable AS & A Level Physics revision notes

The instantaneous velocity is found by drawing a tangent on the displacement time graph

Average Speed / Velocity

  • The average speed (or velocity) is the total distance (or displacement) divided by the total time
  • To find the average velocity on a displacement-time graph, divide the total displacement (on the y-axis) by the total time (on the x-axis)
    • This method can be used for both a curved or a straight-line on a displacement-time graph

Worked example

A cyclist travels a distance of 20 m at a constant speed then decelerates to a traffic light 5 m ahead. The whole journey takes 3.5 s.Calculate the average speed of the cyclist.

Step 1: Write the average speed equation

Average speed = total distance ÷ total time

Step 2: Calculate the total distance

Total distance = 20 + 5 = 25 m

Step 3: Calculate the average speed

Average speed = 25 ÷ 3.5  = 7.1 m s-1

Uniform & Non-Uniform Acceleration Graphs

  • Three types of graph that can represent motion are displacement-time graphs, velocity-time graphs and acceleration-time graphs

Displacement-Time Graph

  • On a displacement-time graph:
    • The gradient (or slope) equals velocity
    • The y-intercept equals the initial displacement
    • A diagonal straight line represents a constant velocity
      • A positive slope represents motion in the positive direction
      • A negative slope represents motion in the negative direction

    • A curved line represents an acceleration
    • A horizontal line (zero slope) represents a state of rest
    • The area under the curve is meaningless

  • Remember the displacement-time graph can have positive or negative values on the displacement axis. However, a distance-time graph only has positive

Motion graphs (1), downloadable AS & A Level Physics revision notes

Displacement-time graph for different scenarios

Velocity-Time Graph

  • On a velocity-time graph:
    • Slope equals acceleration
    • The y-intercept equals the initial velocity
    • A straight line represents uniform acceleration
      • A positive slope represents an increase in velocity (acceleration) in the positive direction
      • A negative slope represents an increase in velocity (acceleration) in the negative direction

    • A curved line represents the non-uniform acceleration
    • A horizontal line (zero slope) represents motion with constant velocity
    • The area under the curve equals the displacement or distance travelled

  • Remember the velocity-time graph can have positive or negative values on the displacement axis. However, a speed-time graph only has positive

Deceleration Graph

Velocity-time graph for different scenarios

Acceleration-Time Graph

  • On an acceleration-time graph:
    • The slope is meaningless
    • The y-intercept equals the initial acceleration
    • A horizontal line (zero slope) represents an object undergoing constant acceleration
    • The area under the curve equals the change in velocity

Motion graphs (3), downloadable AS & A Level Physics revision notes

Acceleration-time graphs for different velocity scenarios 

You've read 0 of your 0 free revision notes

Get unlimited access

to absolutely everything:

  • Downloadable PDFs
  • Unlimited Revision Notes
  • Topic Questions
  • Past Papers
  • Model Answers
  • Videos (Maths and Science)

Join the 100,000+ Students that ❤️ Save My Exams

the (exam) results speak for themselves:

Did this page help you?

Katie M

Author: Katie M

Katie has always been passionate about the sciences, and completed a degree in Astrophysics at Sheffield University. She decided that she wanted to inspire other young people, so moved to Bristol to complete a PGCE in Secondary Science. She particularly loves creating fun and absorbing materials to help students achieve their exam potential.